
U.S. employers announced 529,914 job cuts through August 2026, and artificial intelligence was the single most-cited reason at 116,175 announcements. This page sets out AI job displacement statistics by industry, occupation group, worker age and job-posting behaviour, using figures from Challenger, Gray & Christmas, the Bureau of Labor Statistics, the Stanford Digital Economy Lab, the Dallas Fed, McKinsey and the World Economic Forum.
AI Job Displacement Statistics by Industry
Which Industries Lead U.S. Job Cut Announcements in 2026?
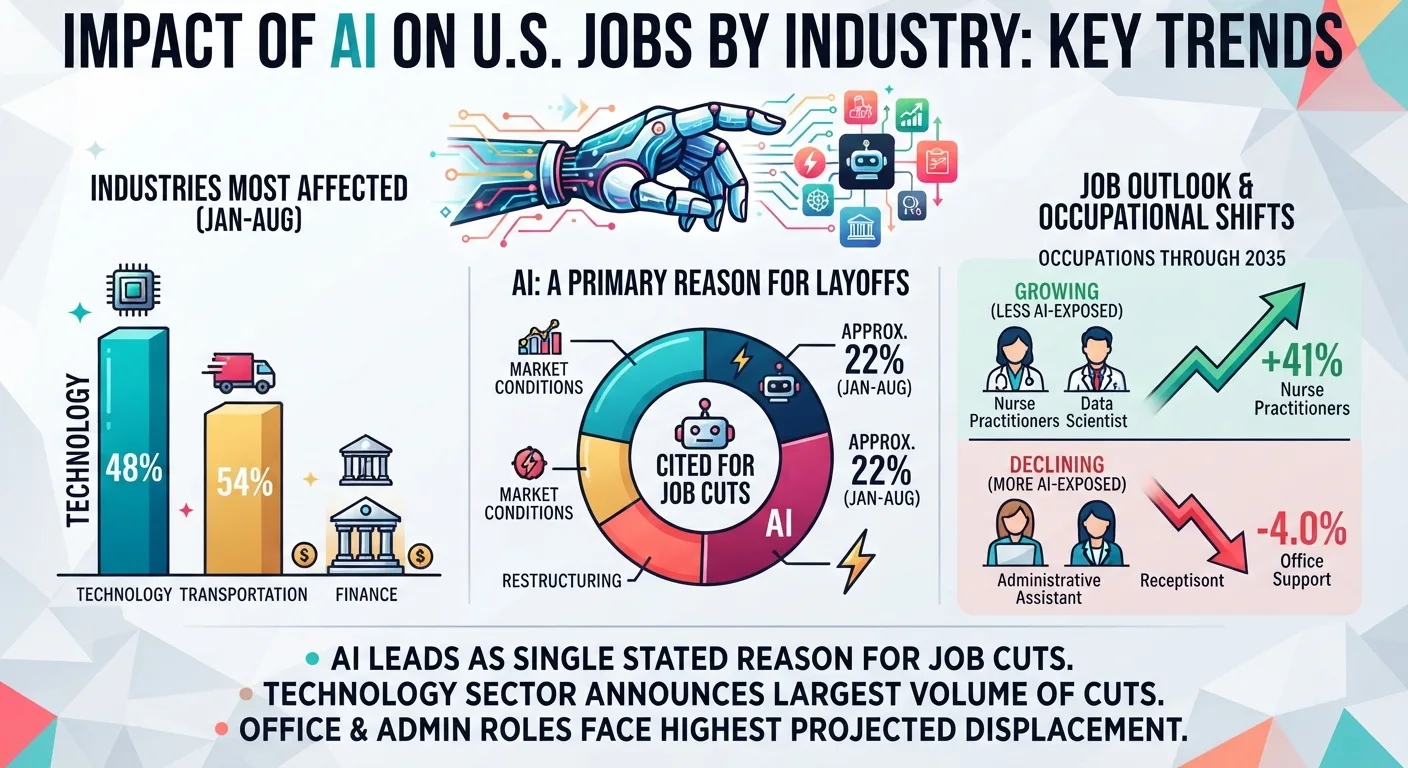
Technology has announced 155,126 cuts through August 2026, more than the next three industries combined. Transportation ranks second at 42,279.
Challenger reports that twenty of the 30 industries it tracks announced fewer cuts than at the same point in 2025. The increases sit in Technology, up 52%, Transportation, up 271%, FinTech, up 305%, and Food, up 75%.
| Industry | Cuts, Jan-Aug 2026 | Cuts, Jan-Aug 2025 |
|---|---|---|
| Technology | 155,126 | 102,239 |
| Transportation | 42,279 | 11,381 |
| Health Care/Products | 35,637 | 36,437 |
| Consumer Products | 28,574 | 35,641 |
| Services | 26,778 | 55,300 |
| Financial | 22,912 | 44,986 |
| Food | 22,367 | 12,761 |
| Warehousing | 18,589 | 41,556 |
| Retail | 13,369 | 83,656 |
| Industrial Goods | 12,423 | 7,693 |
| Insurance | 6,985 | 3,623 |
| All industries | 529,914 | 892,362 |
Source: Challenger, Gray & Christmas, Job Cut Announcement Report, January-August 2026 and January-August 2025. Figures are announced cuts, not completed separations.
Retail announced 13,369 cuts, down 84% from 83,656. Government fell 92% to 22,229 after the federal reductions that dominated 2025. The sectors expanding their cuts are dense in software, clerical and back-office roles, which is also why questions such as whether a Chromebook handles real programming work keep drawing traffic through a tech layoff cycle.
Monthly Announcements, 2026 Against 2025
August 2026 recorded 52,881 cuts, up 58% from July’s 33,429 and down 38% from August 2025. Challenger calls it the lowest August total since 2022.
How Much of 2026 Job Loss Is AI Job Displacement?
AI led every month from March through July 2026, then fell to fourth place in August with 3,462 cuts. Restructuring took the top spot for the month at 16,173.
Across January to August, AI remains the leading year-to-date reason at 116,175 announcements, approximately 22% of the 529,914 total.
| Stated reason | August 2026 | Jan-Aug 2026 |
|---|---|---|
| Artificial Intelligence | 3,462 | 116,175 |
| Market/Economic Conditions | 15,260 | 105,335 |
| Closing | 6,743 | 91,373 |
| Restructuring | 16,173 | 73,649 |
| Contract Loss | 1,284 | 42,042 |
| Cost-Cutting | 1,171 | 35,873 |
| Technological Update (automation) | none recorded | 1,353 |
Source: Challenger, Gray & Christmas, Job Cut Announcement Report, August 2026. Selected reasons from a 26-category list applied to the same 529,914 announcements shown above.
Hiring plans moved the other way. Employers announced 119,825 planned hires through August, up 37% from 87,626 a year earlier, and Technology led that column too at 19,751.
AI Job Displacement Statistics by Occupation Group Through 2035
BLS released its 2025-2035 projections on 27 August 2026. Total employment is projected to rise from 170.3 million to 176.2 million, growth of 3.5%.
Office and administrative support declines fastest at -4.0% and loses 752,100 jobs, more than any other major group. BLS ties this to the continued integration of automation tools, including those powered by AI, into workflows.
| Major occupational group | Projected change, 2025-2035 |
|---|---|
| Healthcare support | +13.3% |
| Healthcare practitioners and technical | +8.0% |
| Life, physical, and social science | +7.5% |
| Community and social service | +7.4% |
| Computer and mathematical | +7.3% |
| All occupations | +3.5% |
| Production | -0.4% |
| Sales and related | -1.4% |
| Office and administrative support | -4.0% |
Source: U.S. Bureau of Labor Statistics, Employment Projections 2025-2035, released 27 August 2026.
BLS names two further AI-linked declines. E-commerce growth and AI in the sales process contribute to losses in sales and related occupations, and generative AI software may limit demand for some jobs in arts, design, entertainment, sports and media.
Among detailed occupations, nurse practitioners grow fastest at +41.0% and data scientists reach +34.6%. That split between hands-on care and model-building sits behind much of the current AI-related job creation data.
AI Job Displacement Statistics by Worker Age
The Stanford Digital Economy Lab published a revised version of “Canaries in the Coal Mine?” in August 2026, using ADP payroll records through June 2026.
Employment for workers aged 22 to 25 in the two most AI-exposed quintiles fell about 11% between November 2022 and June 2026. The same age group in the three least-exposed quintiles grew about 10%.
Measured as a shortfall against less-exposed peers, the gap for 22 to 25 year-olds was 15% at the July 2025 data vintage and 19% as of June 2026. Experienced workers show no comparable gap.
Two findings narrow the reading. The adjustment operates primarily through reduced hiring rather than increased separations, and the declines concentrate in occupations where AI usage automates tasks; where usage complements workers, employment is flat or rising. The authors describe these as descriptive patterns, not causal estimates.
Age also shapes who reaches for the tools in the first place, a pattern visible in AI tool usage by age group.
Source: Stanford Digital Economy Lab, “Canaries in the Coal Mine? Six Facts About the Recent Employment Effects of Artificial Intelligence”, revised August 2026, ADP payroll data through June 2026.
Do Job Postings Signal AI Job Displacement Before Layoffs?
Dallas Fed economists Samuel Dodini and Tucker Smith linked occupational AI-automation exposure to Lightcast job postings in Texas, publishing on 1 September 2026.
Postings fell 5% for more-exposed positions relative to less-exposed ones by the end of 2023, and by approximately 8% by the first quarter of 2025. Among surviving incumbent firms, the gap ran 5 to 6% by the middle of 2024 and 8 to 9% by early 2026.
Scaled across Texas industry composition, the researchers estimate that generative-AI automation exposure reduced total Lightcast job postings in Texas by 1.8% in 2024 and by 2.6% in 2025.
Composition shifted alongside volume. Firms whose pre-ChatGPT listings were destined to become 10% more automatable posted jobs with 2 percentage points fewer automatable tasks afterwards, close to half the mean in the data.
Two-thirds of firms in the May 2026 Texas Business Outlook Survey reported using AI, up from 40% two years prior. Employer-side counts of which AI tools staff use at work track the same broadening.
Source: Federal Reserve Bank of Dallas, “Job postings show early signs of AI automation impact”, 1 September 2026; Texas Business Outlook Survey, May 2026.
Employer Forecasts Against Recorded AI Job Displacement
McKinsey fielded its State of AI survey online from 4 May to 8 June 2026, collecting 1,719 responses across 97 nations, weighted by each country’s contribution to global GDP.
Fourteen percent of respondents at organisations using AI said it contributed to a decline in total workforce size over the past year. That is less than half the 32% who, in the 2025 survey, expected a decline over the same period.
Looking ahead, 39% expect AI to decrease headcount over the next year and 43% expect little or no change. These are respondent expectations, not forecasts checked against employment records.
Source: McKinsey & Company, The State of AI: Global Survey 2026, fielded 4 May to 8 June 2026, 1,719 respondents.
Global Projections to 2030
The World Economic Forum’s Future of Jobs Report 2025, built on responses from more than 1,000 employers across 22 industries and 55 economies, projects 170 million roles created and 92 million displaced by 2030 through structural labour-market transformation, a net increase of 78 million.
That churn equals 22% of the 1.2 billion formal jobs in the dataset. Separately, 41% of surveyed employers said they plan to reduce their workforce as AI automates certain tasks.
Source: World Economic Forum, Future of Jobs Report 2025, published 8 January 2025, Future of Jobs Survey 2024.
What the 2026 AI Job Displacement Data Shows
AI is the leading stated reason for U.S. layoff announcements at 116,175 through August 2026, yet it accounts for roughly 22% of a national total that is itself down 41% year over year.
Displacement concentrates by age and task type. The 19% shortfall for workers aged 22 to 25 in exposed occupations has no counterpart among experienced workers.
Employer expectations continue to run ahead of recorded outcomes by more than two to one. Companies that shifted administrative work to home and hybrid setups are still absorbing much of it rather than eliminating it.
FAQs
How many jobs has AI cut in 2026?
Employers cited artificial intelligence in 116,175 announced U.S. job cuts from January through August 2026, about 22% of the 529,914 total, according to Challenger, Gray & Christmas. These are announcements, not confirmed separations.
Which industry is most affected by AI job displacement?
Technology. It announced 155,126 cuts through August 2026, 29% of all U.S. announcements and 52% above the 102,239 announced through August 2025, per Challenger, Gray & Christmas.
Which jobs will AI reduce most by 2035?
Office and administrative support. BLS projects a 4.0% decline and 752,100 fewer jobs from 2025 to 2035, citing automation tools including AI. Sales and related occupations fall 1.4%.
Is AI hitting entry-level workers hardest?
Stanford Digital Economy Lab payroll data through June 2026 shows employment for workers aged 22 to 25 in AI-exposed occupations 19% below their less-exposed peers. Experienced workers show no comparable gap.
Do Reddit layoff threads match the official AI job displacement data?
Reddit posts are self-reported and unverified. Measured sources agree on direction but smaller scale: AI drove about 22% of 2026 announcements, and only 14% of McKinsey respondents recorded an actual headcount decline.
Sources