Written by: Muhammad Umair
Here at Mandiant FLARE, malware reverse engineering is a regular part of our day jobs. At times we are required to perform basic triages on binaries, where every hour saved is critical to incident response timelines. At other times we examine complicated samples for days developing comprehensive analysis reports. As we face larger and more complex malware, often written in modern languages like Rust, knowing where to go, what to look at, and developing a “map” of the malware forms a significant effort that directly impacts our response times and triage effectiveness.
Today we introduce a new tool, XRefer (pronounced eks-reffer), which aims to shoulder some of this burden for anyone who endeavors to go down these rabbit holes like us, helping analysts get to the important parts faster while maintaining the context of their investigation.
- aside_block
- <ListValue: [StructValue([('title', 'Get XRefer now!'), ('body', <wagtail.rich_text.RichText object at 0x3e99d6298280>), ('btn_text', 'Download'), ('href', 'https://github.com/mandiant/xrefer'), ('image', None)])]>
Introduction
XRefer provides a persistent companion view to assist analysts in navigating and understanding binaries. It’s a modular and extensible tool that comes in the form of an IDA Pro plugin. Figure 1 shows the XRefer interface.

Figure 1: XRefer opened as a side pane, displaying Cluster Tables
At its core, XRefer offers two complementary navigation paradigms:
-
Gemini-powered cluster analysis, which decomposes the binary into functional units and leverages the large language model (LLM) to describe their purpose and relationships. Think of this like viewing a city from Google Maps: you can quickly identify the business districts, residential areas, and green spaces. In binary terms, this feature helps identify functional groupings like command-and-control communication, persistence mechanisms, or information-gathering routines, giving you a strategic view of the malware’s architecture.
-
A context-aware view, which dynamically updates based on your current location in the code. This view presents both immediate artifacts of the current function and those from related functions along the same execution path. It’s similar to standing outside a shopping mall with X-ray vision: without entering each store, you can see the restaurant menus, shop inventories, and services offered on each floor. This allows you to make informed decisions about which areas deserve deeper investigation. Just as a mall directory helps you efficiently plan your shopping route, XRefer’s context-aware view helps analysts quickly identify relevant code paths by surfacing APIs, strings, capa matches, library information, and other artifacts that might otherwise require manual exploration of multiple functions.
Let’s take a closer look at each of these paradigms, beginning with cluster-based navigation.
The Birds-Eye View: Cluster-Based Binary Navigation
One of XRefer’s key features is its ability to break down a binary into functional units, providing an immediate high-level understanding of its architecture. To demonstrate this capability, let’s examine an ALPHV ransomware sample written in Rust. Despite containing over 2,700 functions, XRefer’s analysis organizes key functionality of this complex binary into clear functional clusters, as shown in the Cluster Relationship graph in Figure 2.

Figure 2: Cluster Relationship graph view
These functional clusters are descriptively labelled as follows:
-
Ransomware Main Module
-
Configuration Parsing Module
-
User Profile and Process Information Module
-
Privilege Escalation, System Information, and AntiAnalysis Module
-
File Processing Pipeline Module
-
Network Communication and Cluster Management Module
-
Thread Synchronization and Keyed Events Module
-
File Path and Encryption Key Generation Module
-
Console Clearing Module
-
UI Rendering and Console Output Module
-
Image Generation and Encoding Module
-
Data Encoding and Hashing Module
-
File Discovery and Dispatch Module
-
Thread Synchronization and Time Management Module
While each cluster contains deeper sub-clusters that analysts can explore, we’ll focus on the high-level view for now. The clustering and relationship identification is performed through static analysis. XRefer then leverages Gemini to provide natural language descriptions of each cluster and how they relate to one another. Figure 3 illustrates key components in the graph navigation interface.

Figure 3: Cluster graph view
At the top, the view provides a brief description of the binary’s functionality and its category. Next, it describes the currently selected cluster and its relationships to other clusters. For convenient navigation, the cross-references of that cluster are listed, followed by a visual graph representation. For readability, these details are transcribed in Table 1.
Table 1: Transcribed information from Figure 3
The clusters can also be viewed in a linear format within XRefer’s interface, as shown in Figure 1.
To better demonstrate cluster navigation visually, we’ve used a lightweight backdoor that displays more clearly on screen. Figure 4 provides a quick glimpse of the cluster navigation workflow, showing how analysts can quickly browse clusters and navigate to their respective functions in the disassembly or pseudocode views.
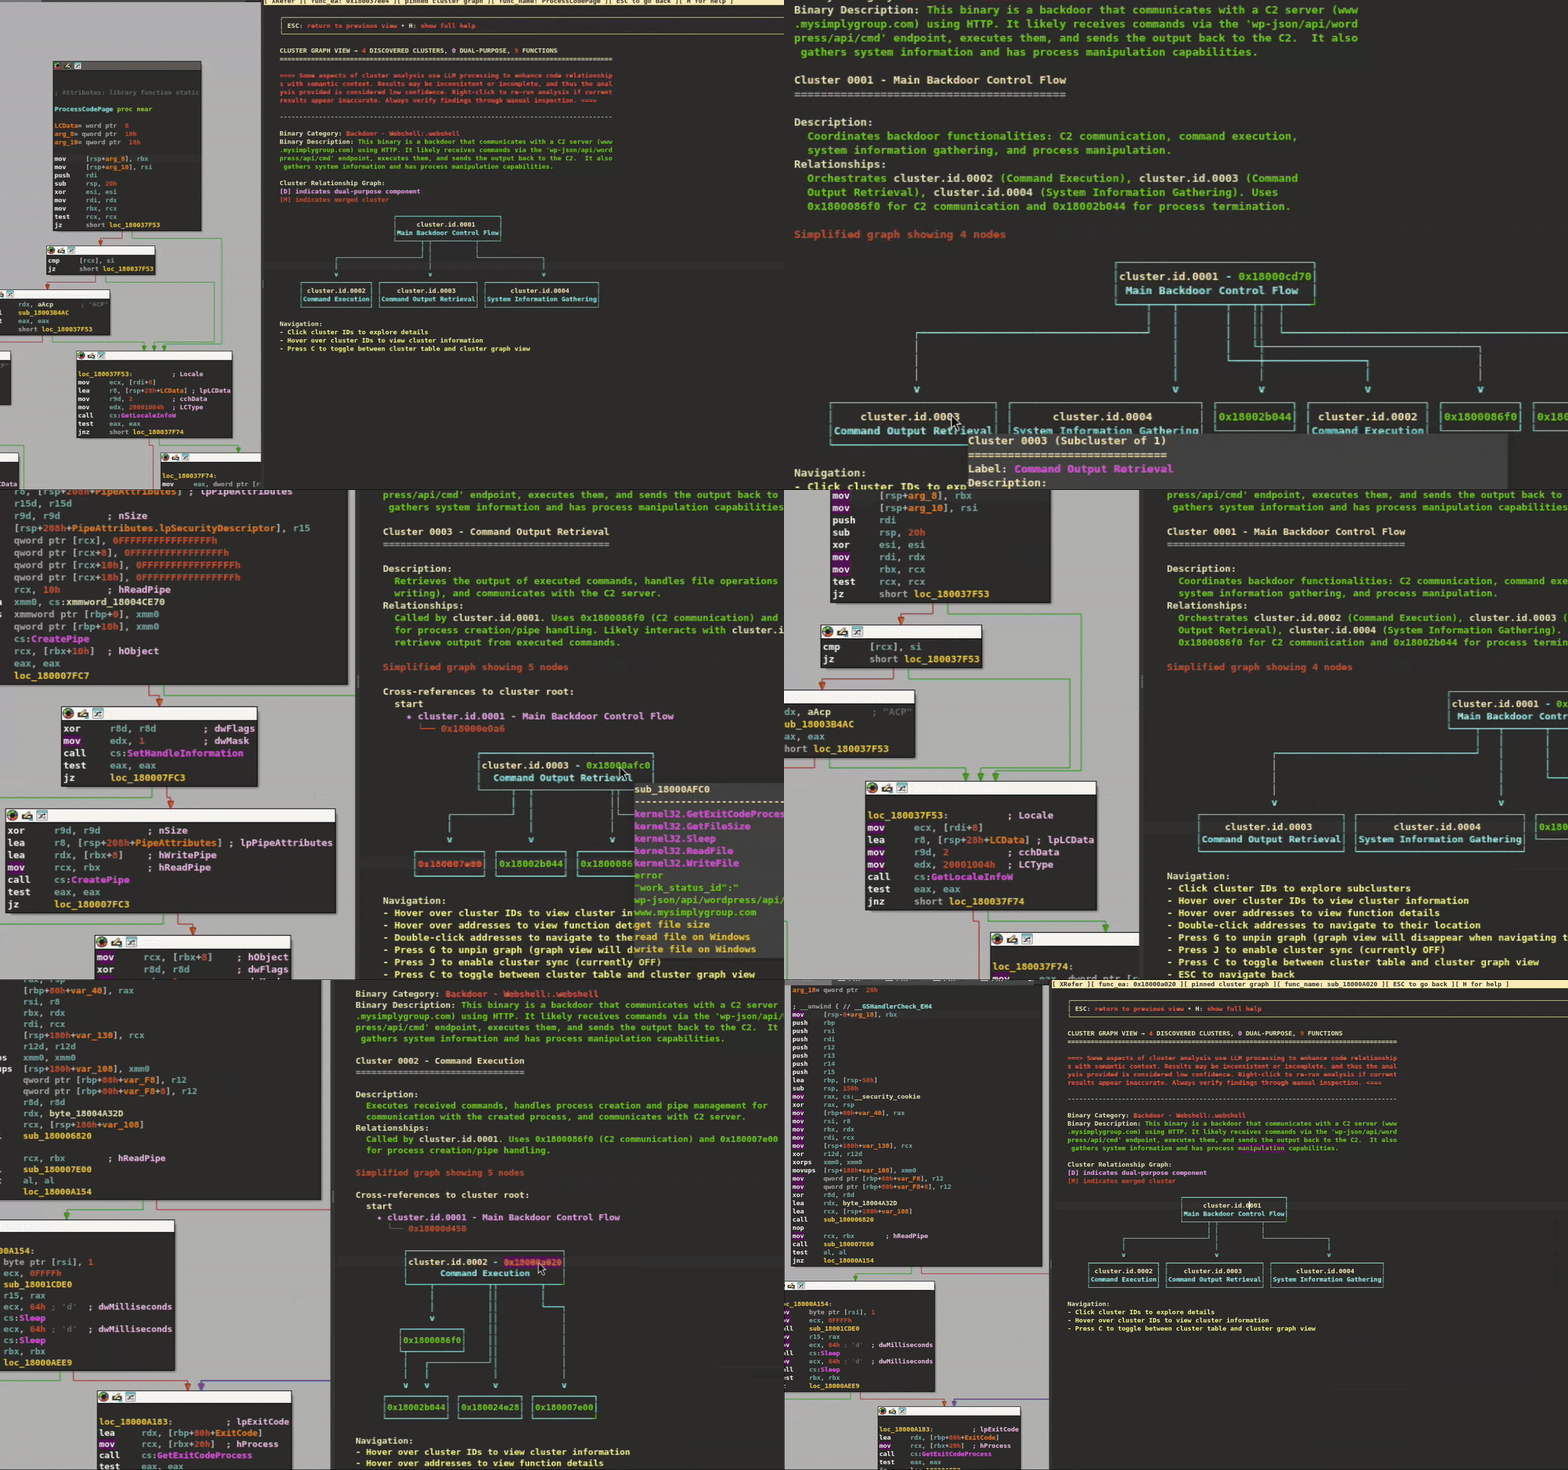
Figure 4: Hover over clusters/functions to provide information pop ups. Click to navigate inside them. Double click on addresses to navigate to those functions.
The navigation can automatically sync with clusters—when you navigate to a function that belongs to a known cluster, XRefer can automatically open that cluster’s view and highlight the current function within it. XRefer offers two approaches to clustering:
-
Cluster all paths that are part of XRefer’s analysis (XRefer’s analysis is discussed later)
-
Cluster a focused subset of functions, pre-filtered by Gemini based on their artifacts
Note: Throughout this blog post, we use the term “artifacts” to refer to binary elements like strings, API calls, library references, and other extractable information that help understand program behavior.
By default, XRefer employs the first method. While this approach is comprehensive, it may create additional clusters around unidentified libraries in the program. These library clusters are typically easy to identify and exclude from analysis.
The second clustering method is optionally available via the context menu and proves valuable for automatically filtering out library, runtime/compiler artifacts, and repetitive noisy functions. However, due to the inherent nature of LLMs, this approach can be inconsistent—artifacts might be missed, and results can vary between runs. While missed artifacts can usually be recovered through a quick re-run of the LLM analysis, this variability remains an inherent characteristic of this approach.
XRefer can also display these LLM-filtered artifacts in a dedicated view, separate from the clustering visualization. This view, shown in Figure 5, provides analysts with a streamlined overview of the binary’s most relevant artifacts while filtering out noise like library functions and runtime artifacts.

Figure 5: Interesting artifacts and their corresponding functions filtered out by Gemini
It’s important to note that clusters aren’t perfect boundaries. They may not capture every related function and can contain functions that are reused across different parts of the binary. However, any missed related functions will typically be found in the vicinity of their logical cluster, and reused functions are generally easy to identify at a glance. The goal of clustering is not to create strict divisions, but rather to establish general zones and subzones of related functionality.
Function Labeling: Prefixing Cluster Membership in Names
XRefer can optionally encode cluster information directly into IDA’s interface by prefixing function names. These labels provide architectural context directly inside the disassembly and pseudocode windows. Table 2 shows the classification system used to prefix functions based on their cluster relationships.
Table 2: XRefer’s function prefix categories and their architectural significance
Down in the Trenches: Context-Aware Code Navigation
Having seen how XRefer’s cluster analysis provides a high-level view of binary architecture, let’s examine its second navigation paradigm: a context-aware view that updates automatically based on the function currently being analyzed.

Figure 6: Function context table
The function context table (shown in Figure 6) organizes information into three main components:
-
Cluster Membership – At the top, displaying which clusters the current function belongs to. Functions appearing in multiple clusters often indicate utility or helper functions rather than specialized functionality.
-
Direct References – Listed under “DIRECT XREFS,” showing artifacts directly used or called by the current function.
-
Indirect References – Categorized tables prefixed with “INDIRECT,” showing artifacts used by all functions called through the current function’s execution paths. This provides a preview of downstream functionality without requiring manual traversal of each function.
Both direct and indirect references include:
-
APIs and API traces
-
Strings
-
Libraries
-
capa results
For direct references, each artifact is listed with its reference addresses. Double clicking these addresses jumps to their exact location in the current function. For indirect artifacts, the displayed addresses are different—they point to function calls within the current function that eventually lead to those artifacts through execution paths. This x-ray-like capability eliminates the tedious process of diving into nested function calls to discover artifacts and functionality, only to return to the primary function.
XRefer extends this visibility through its Peek View feature, accessible via the context menu. When enabled, clicking on any function dynamically filters the artifact view to display only those elements that lie along its execution paths. This instant preview allows analysts to quickly assess a function’s downstream behavior without manually tracing through its call graph, significantly streamlining the exploration of complex codebases. Figure 7 demonstrates how this functions in practice.
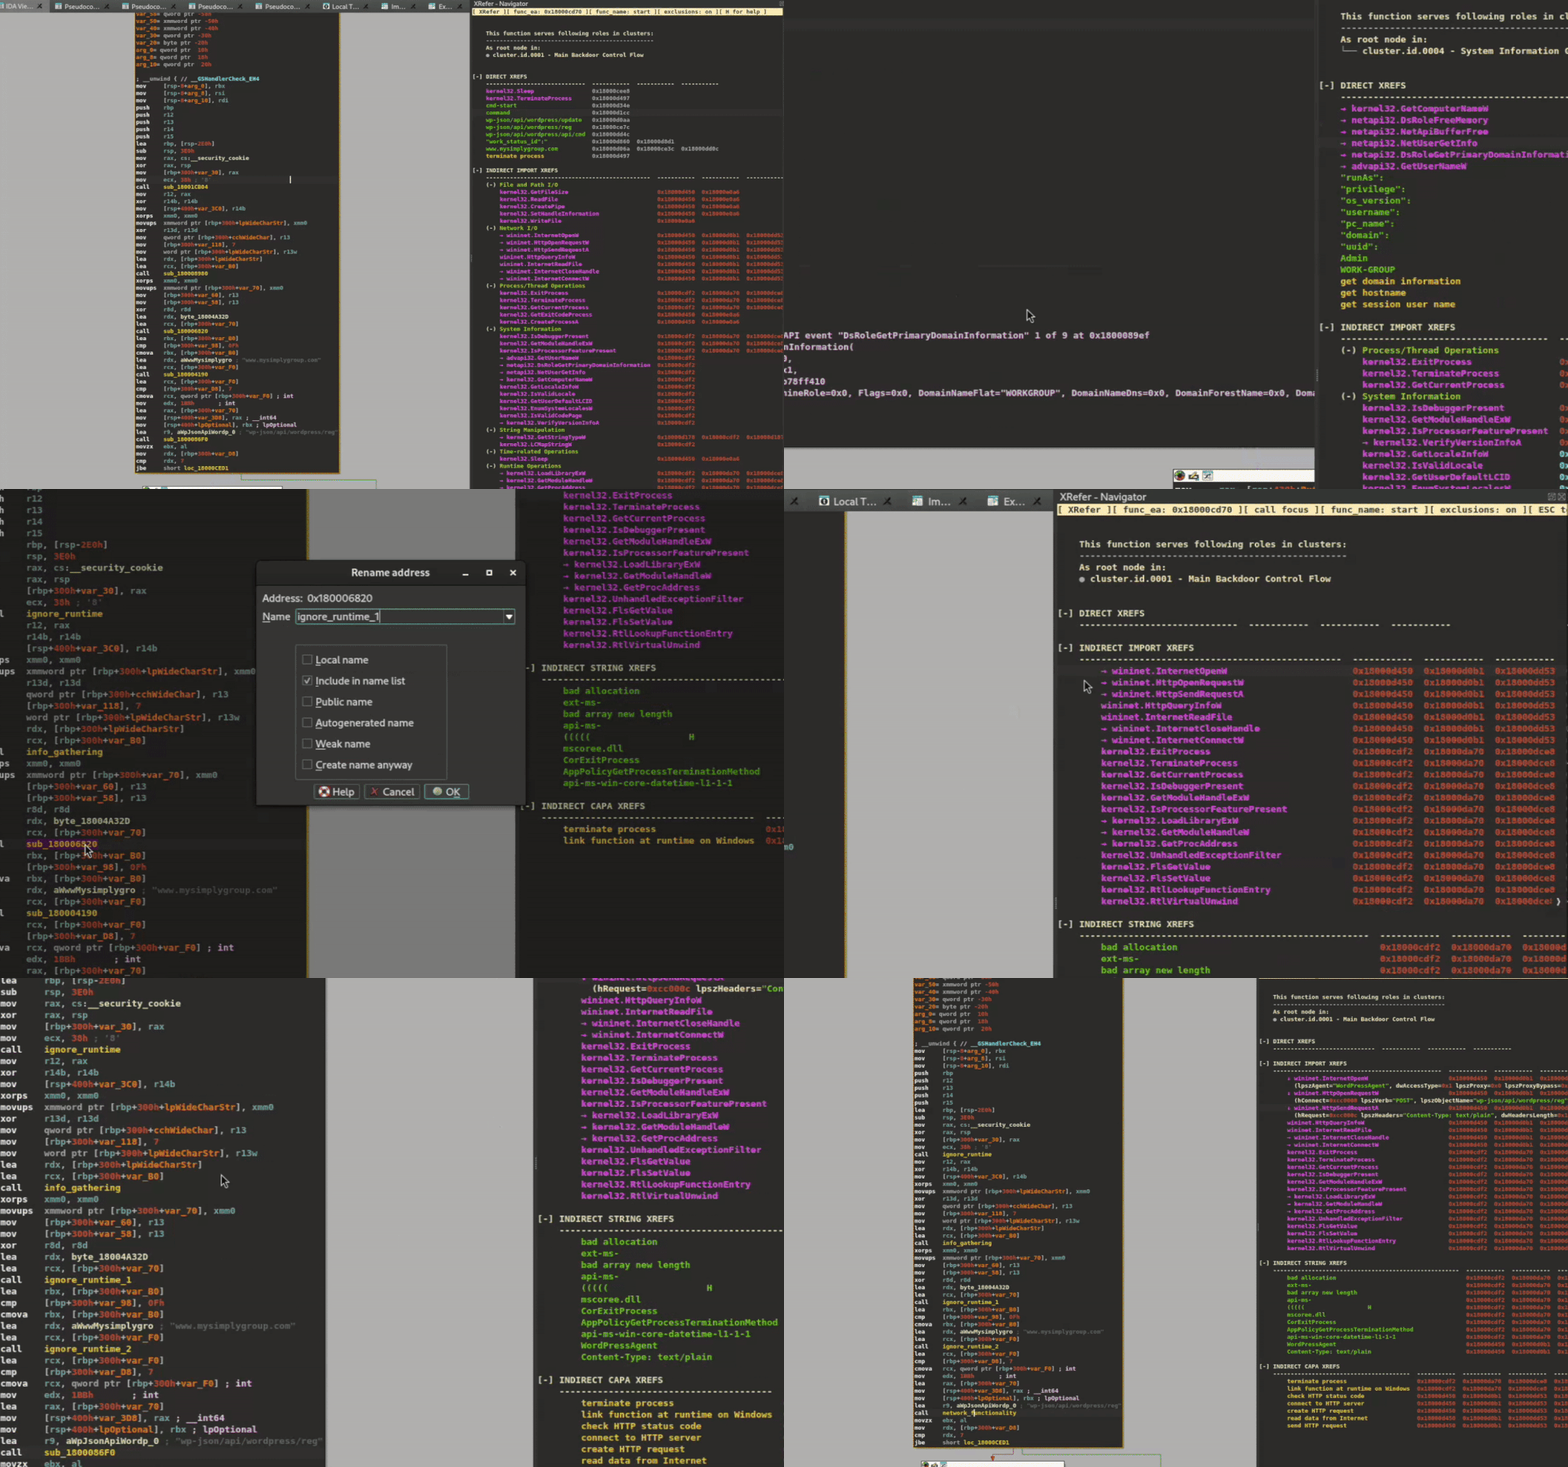
Figure 7: Peek View filtering artifacts based on selected function’s execution paths
Beyond Peek View, XRefer offers on-demand artifact filtering through key bindings. A core design principle of XRefer is the uniform treatment of all artifact types—any operation available for one type of artifact is consistently available across all others. For instance, path analysis capabilities that work with API references can be similarly applied to capa results. Let’s examine the key functionalities available under this navigation paradigm.
Path Graphs
XRefer can generate and visualize all simple paths from the entry point to any type of artifact. These interactive graphs serve as powerful navigation tools, particularly when analysts need to trace specific functionality through the binary. Figure 8 demonstrates this capability by displaying all execution paths leading to GetComputerNameW in the ALPHV ransomware sample. Each function node in the graph provides a contextual pop-up showing its complete artifact inventory.
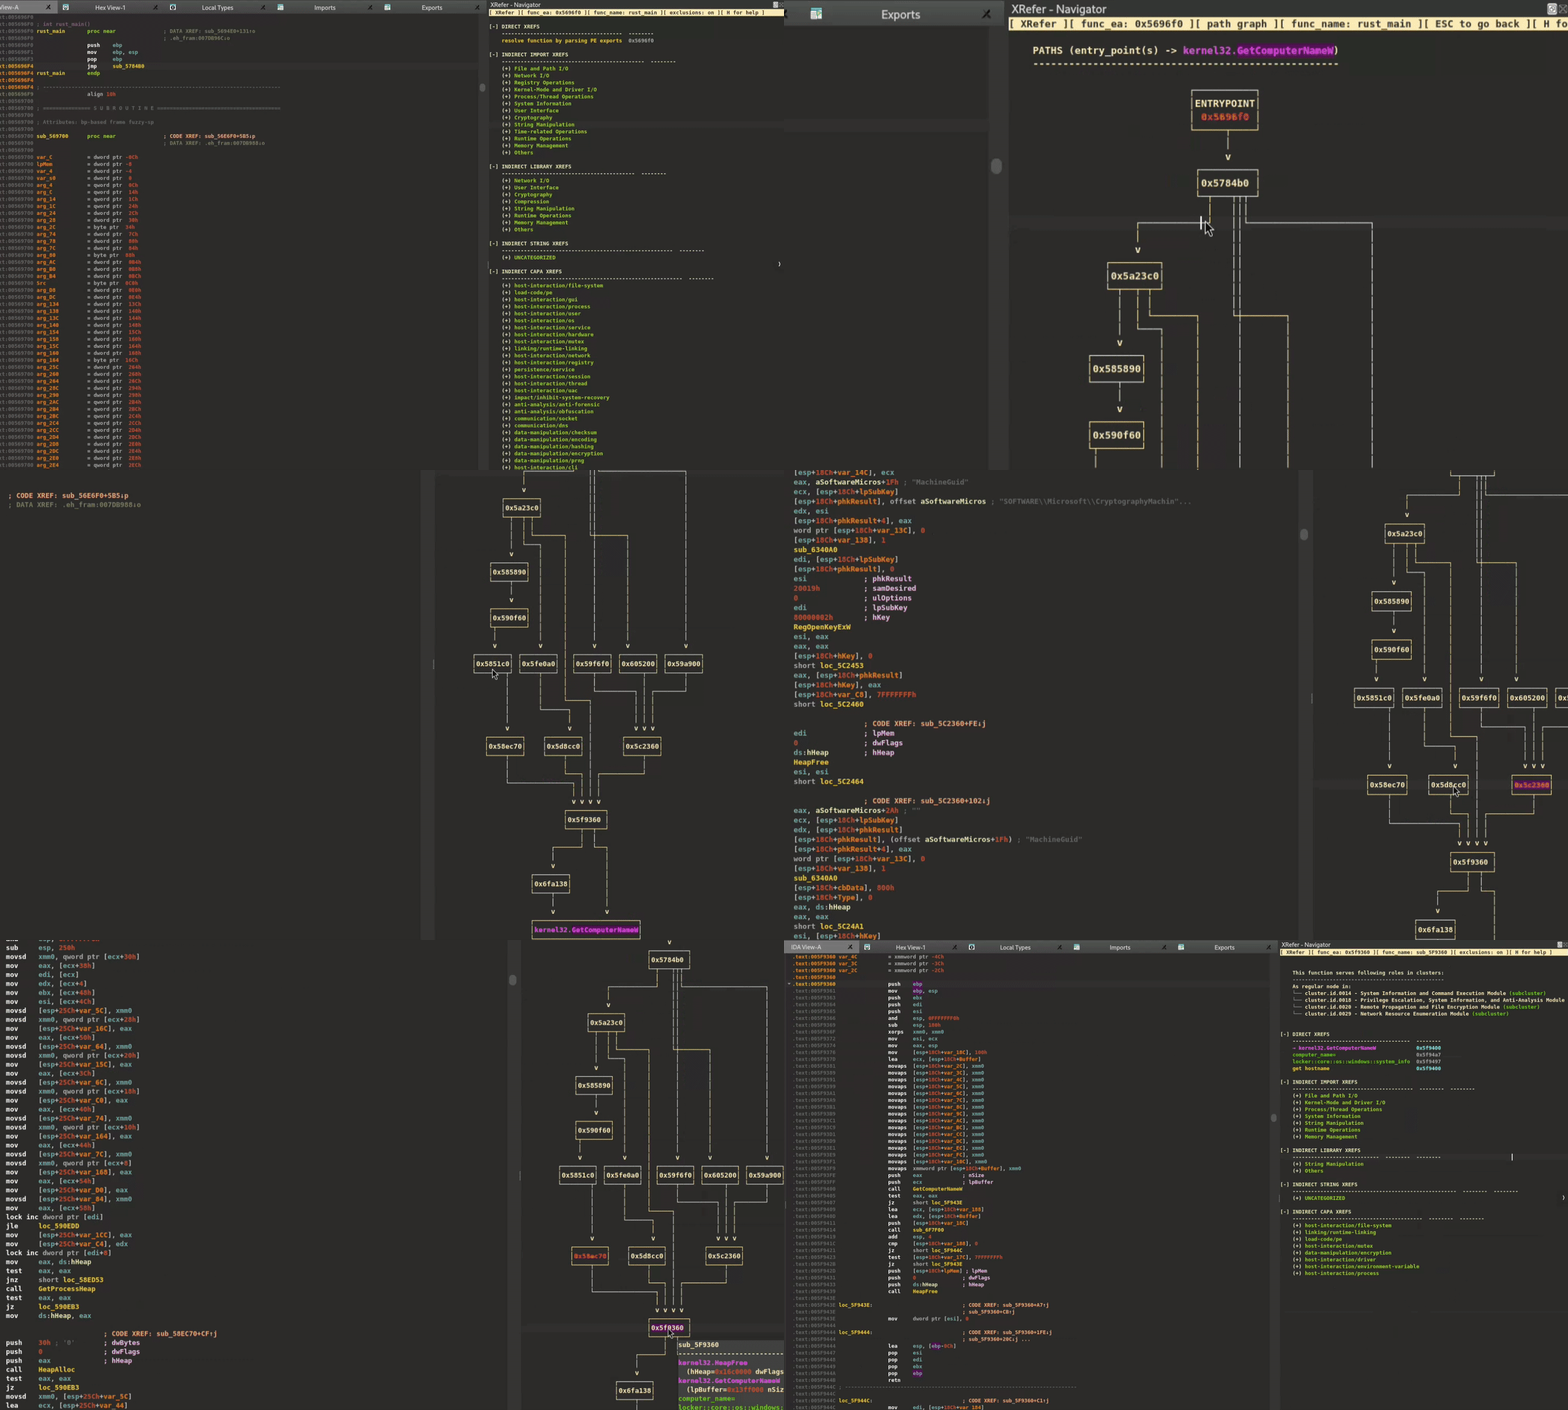
Figure 8: Searching for an artifact, drawing its path graph, and using it to navigate while glancing over function artifacts through pop-ups
Path graphs include a simplification feature that can reduce visual complexity by omitting nodes that either contain no artifacts or contain only excluded artifacts (exclusions are discussed later). Figure 10 illustrates this simplification, where the graph is reduced from 15 to 12 nodes, representing a 20% reduction in complexity. While more complex graphs can achieve higher simplification ratios, their full visualization extends beyond the practical constraints of this blog post.

Figure 9 (left) and Figure 10 (right): Showing side by side versions of an example normal path graph and its corresponding simplified path graph with 20% reduction
Search
XRefer provides unified search functionality across all artifact types directly within the function context table view. Figure 8 demonstrates this capability while searching for the API reference used in path graph generation.
Cross References++
XRefer implements its own cross-reference view that goes beyond IDA Pro’s traditional functionality (accessed via “X”). This view, similarly triggered by pressing “X” on any artifact, encompasses all artifact types, including elements that IDA Pro cannot typically track, such as capa results, APIs identified through dynamic traces, and strings extracted by language-specific modules like the Rust parser.
Trace Navigation
While API traces are integrated throughout XRefer’s interface—from function context tables (Figure 6) to information pop-ups (Figure 8)—the plugin also offers dedicated trace navigation modes. These three modes, illustrated in Figure 11, provide views of API calls with their arguments, each offering different levels of scope:
-
Function Scope – Shows only the API calls made directly within the current function, providing a clean view of its immediate external interactions
-
Path Scope – Reveals all API calls that occur downstream from the current function, following its execution paths. This helps analysts understand the complete chain of system interactions triggered by a particular function.
-
Full Trace – Displays the complete API trace captured during dynamic analysis, regardless of static code paths. Useful when you may have calls associated with encrypted regions in the binary or generally from dynamically resolved APIs.
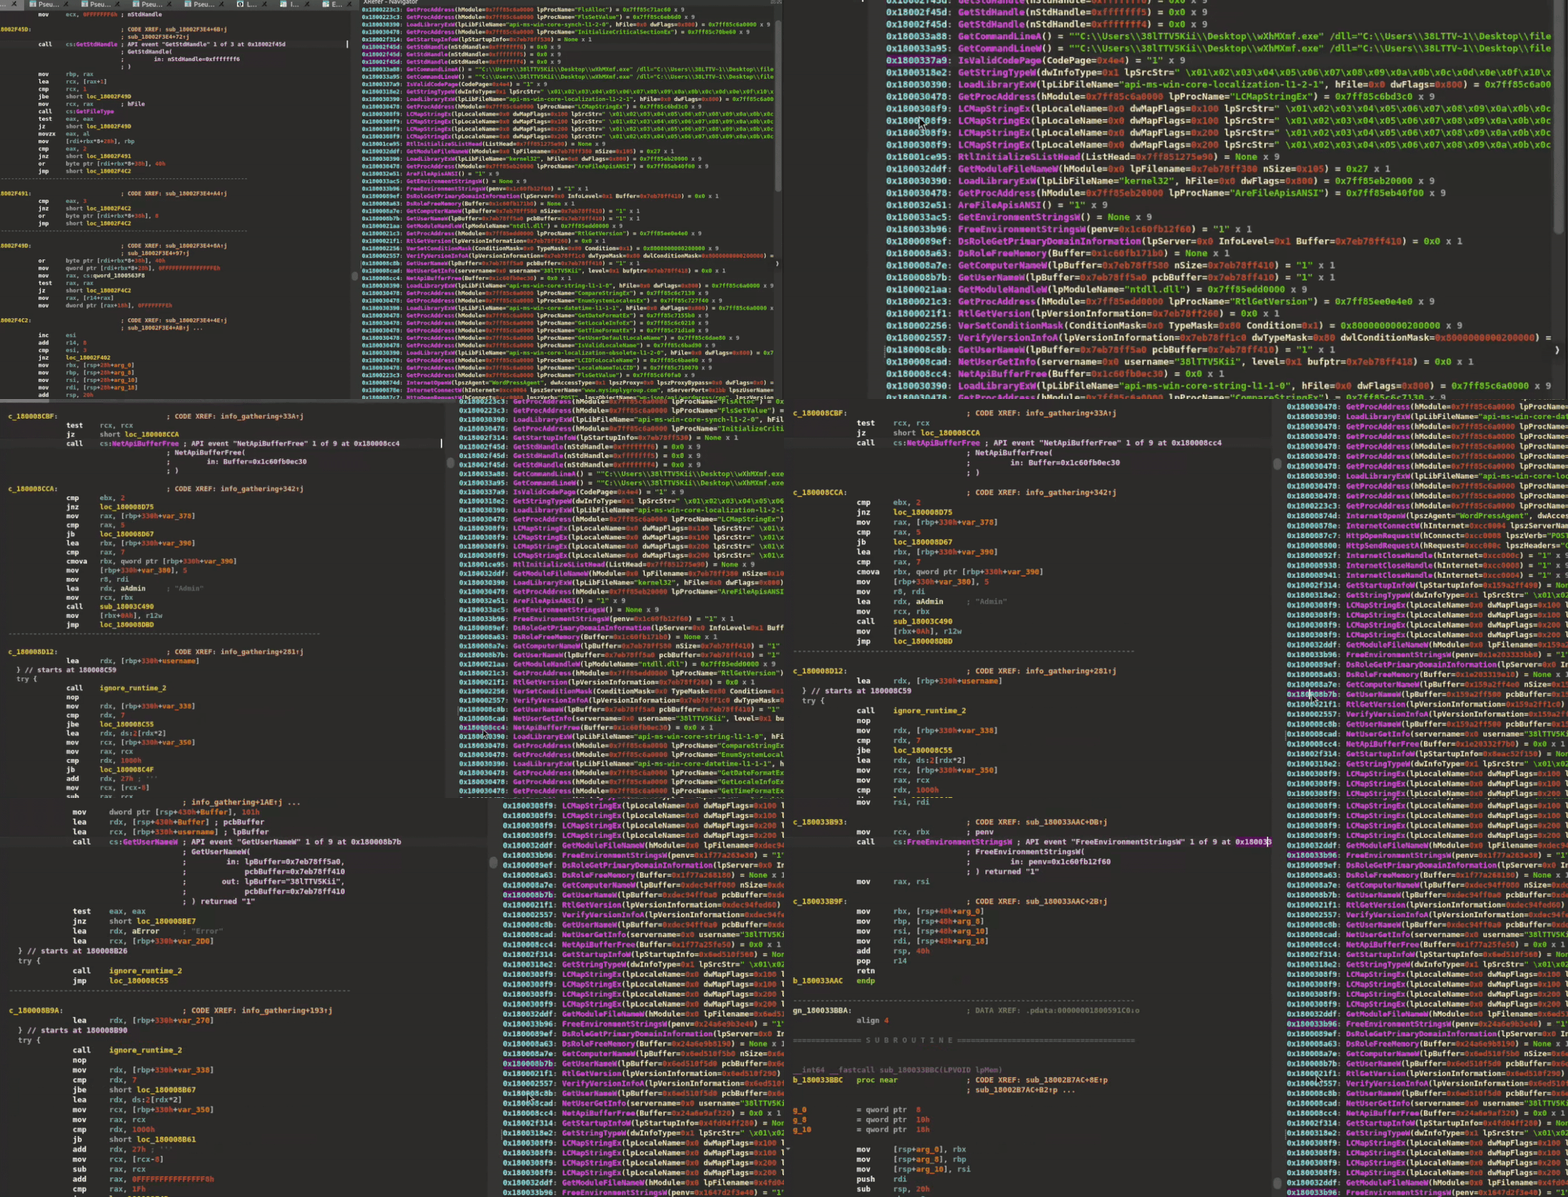
Figure 11: API trace-based navigation
Artifact Exclusion
XRefer supports artifact exclusion to reduce noise when analyzing large, complex binaries. Excluded artifacts are omitted from multiple views and processes including the main interface, cluster analysis, and simplified path graphs.
Artifacts can be excluded in two ways:
-
Directly through XRefer’s interface, where multiple artifacts can be selected and excluded using key bindings
-
Via the settings dialog (shown in Figure 12), which supports wildcard-based exclusion patterns. For instance, noisy Rust standard library references can be filtered using patterns like
std*, providing efficient bulk exclusion of known noise sources.
These exclusions persist across sessions, allowing analysts to maintain their preferred filtering setup.
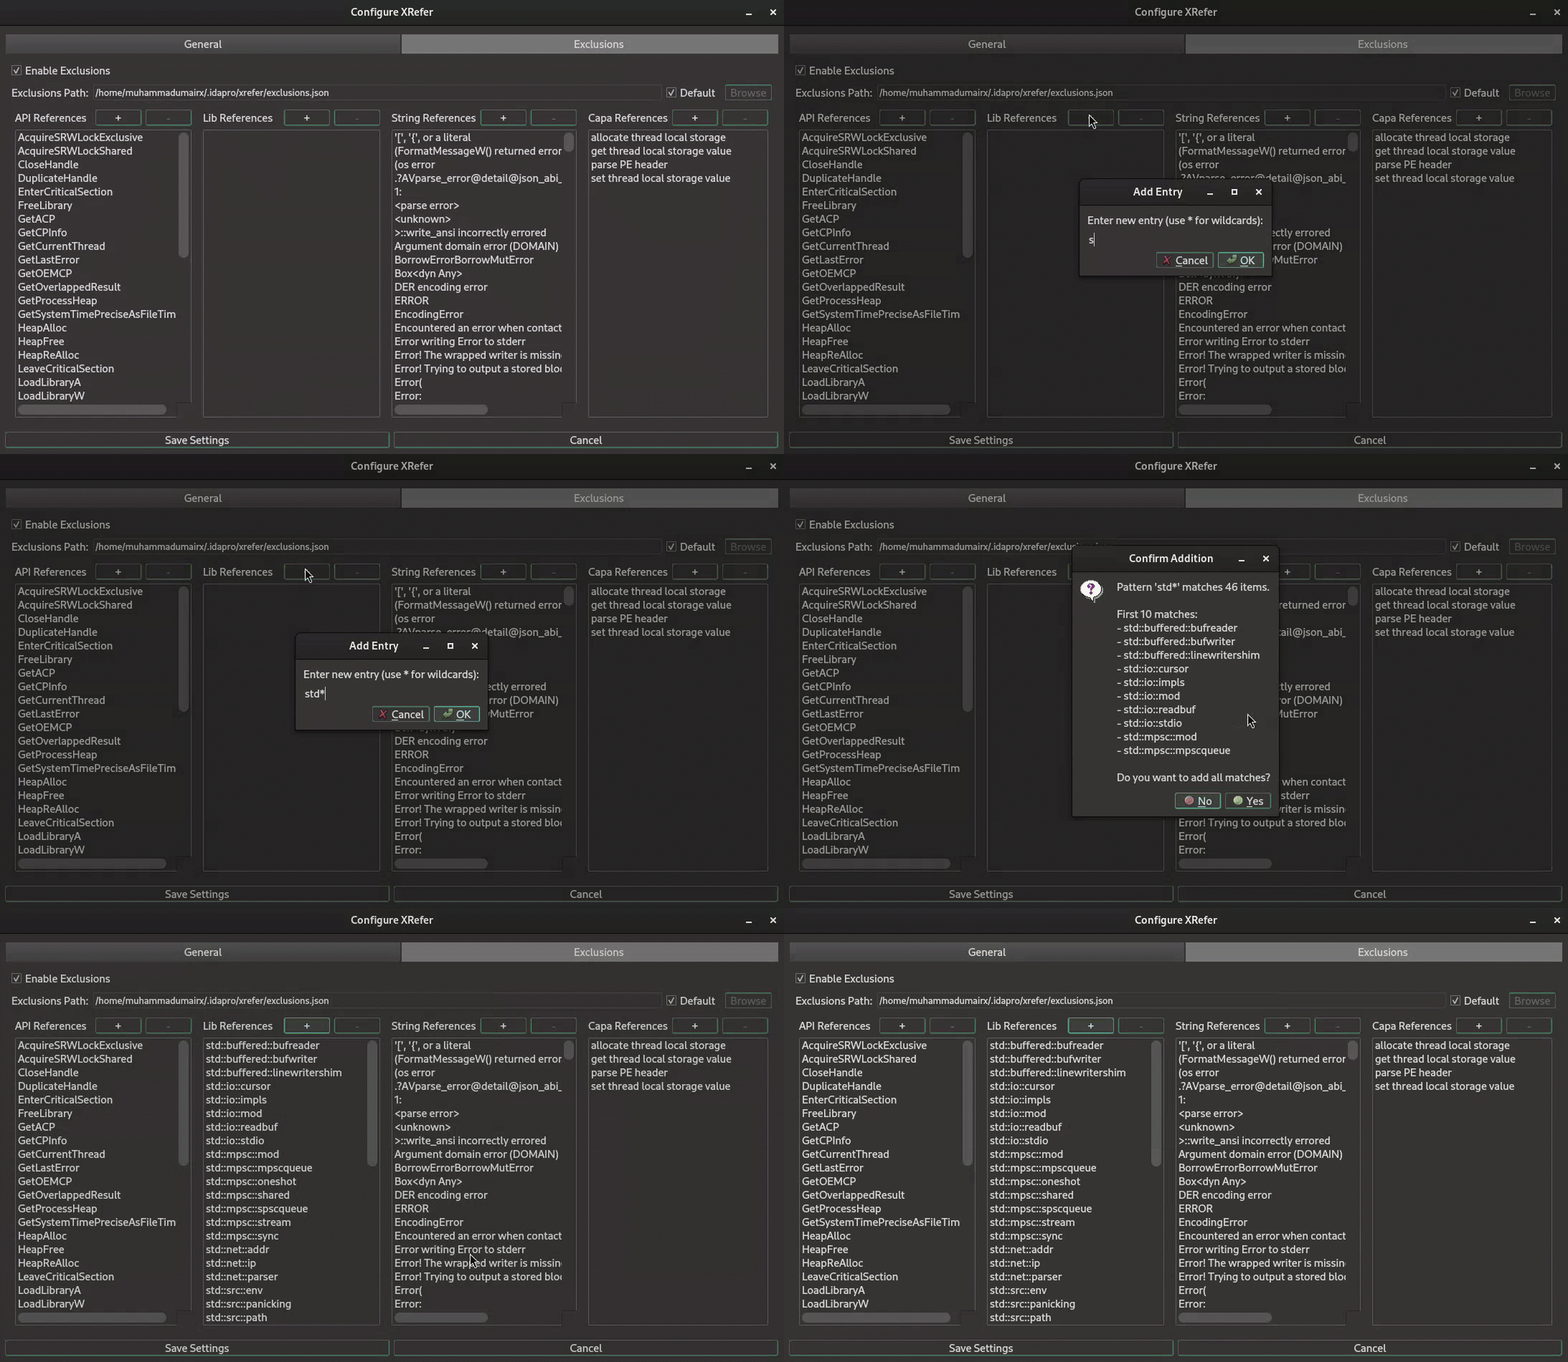
Figure 12: Shows wildcarding artifacts for exclusion from the Settings Dialog
Specialized Rust Support
XRefer has a specialized Rust module (discussed later) that extracts strings and library usage information. During Rust compilation, the compiler embeds library source paths that typically appear adjacent to their corresponding library code within functions. These compiler-inserted references serve two key purposes as function artifacts:
-
Identifying library dependencies and their specific functionality within code sections
-
Providing positional hints that help locate where library code is actually implemented within functions
This compiler-provided context feeds into both XRefer’s cluster analysis and enhances manual navigation, helping analysts quickly locate relevant code regions while understanding which Rust library implementations are being used. The module also includes a basic function renaming capability for Rust binaries, which will be covered in detail later.
Auxiliary Features
Before concluding this section, two standalone features warrant mention, though they operate independently of the clustering mechanism and exclusion system.
Boundary Method Scanning: XRefer allows multiple artifacts to be selected in the function context view for boundary scanning. This operation identifies the Lowest Common Ancestor (LCA) in the call graph for all selected artifacts. In niche scenarios, this can be used to isolate specific functionality based on a subset of artifacts and identify the most specific parent function that encompasses all selected artifacts without intermediate functions. While originally intended to serve a larger purpose in the clustering mechanism, the clustering system ultimately took a different direction, leaving this as a standalone feature.
String Lookups: During processing, XRefer can optionally query strings against public Git repositories through Grep App for categorization purposes. This is strictly a placeholder implementation; locally maintained databases by teams or individuals would be better suited for these queries. The feature operates independently of XRefer’s broader ecosystem, primarily serving to categorize known strings for noise reduction or occasional OSINT insights.
Under the Hood: XRefer’s Analysis Engine
Having explored both navigation paradigms, let’s examine the technical foundation that makes them possible. While a deep dive into XRefer’s internals would warrant its own blog post, understanding a high-level view of its analysis pipelines and extensibility will help set the context.
Ingestion Sources
XRefer builds its understanding of binaries through two primary data ingestion channels:
-
Internal – Whereby it extracts and processes all the imports, strings and any library data from the binary itself. This also involves language-specific modules. XRefer comes out of the box with a Rust-specific language module, and more can be added.
-
External – This includes API traces from third-party tooling and results from capa’s analysis. XRefer currently supports ingestion of API traces from VMRay’s sandbox and Cape Sandbox. Additional modules can be written, for instance, TTD traces would be a good candidate.
Note: Out of the mentioned traces, VMRay produces the best results. Cape sandbox, while good, hooks NT* APIs and is much noisier in terms of visual display as it loses 1:1 API to import mapping. Unfortunately, that’s one of the very few open-source solutions available right now.
XRefer feeds the available data along with cluster relationships in the form of call flows to the LLM, which generates semantic descriptions for each cluster, their relationships, and the overall binary. As demonstrated in Table 3, while external data sources enhance the analysis, XRefer can produce meaningful results even with just internal binary analysis.
Table 3: Example cluster analysis showing how results vary with and without external data (API traces/capa) for an ALPHV sample. Actual analysis quality for any binary depends on the richness of both internal binary artifacts and external data sources.
Note: While LLM-generated labels and descriptions may vary in phrasing between runs, they tend to consistently convey similar semantic information.
Language Modules and Rust
XRefer supports language-specific analysis through dedicated modules and ships with a module for Rust binaries. This allows for specialized handling of language-specific characteristics. The Rust module provides:
-
Identification of rust_main
-
Parsing of Rust thread objects and their indirect calls, improving path coverage
-
Extraction of library/crate information for better code understanding in both cluster analysis and context tables
-
Limited function renaming capabilities for a subset of functions where no inlining conflicts are detected, based on compiler strings and excluding runtime/std/internal libraries

Figure 13 (left) and Figure 14 (right): Subset of library information extracted from ALPHV. The categorization seen here is also performed via Gemini.
Rust Function Renaming
The Rust module includes a limited function renaming capability for Rust binaries, though its approach is deliberately restrictive. While XRefer is not a function identification tool, it can leverage compiler strings embedded in Rust binaries for basic renaming. Due to the prevalence of inlining from compiler optimizations, the module only renames functions where no inlining is detected and excludes internal references (std*, core*, alloc*, etc.) which are particularly prone to inlining.
The renaming doesn’t provide the full function names but does include up to the submodule name. Again, this is not a substitute for proper function identification as only a very small handful of functions can be renamed this way. However, since this capability is not version-specific to the toolchain, platform, and/or crate, it represents a low-hanging fruit that would have been unwise to ignore. As an example, in the ALPHV binary, the Rust module was safely able to rename 362 out of ~2,700 functions.
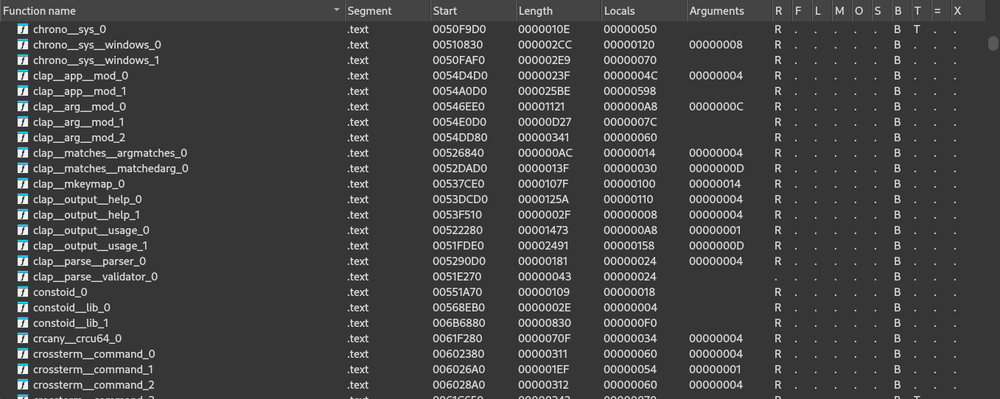
Figure 15: Subset of functions renamed via XRefer’s Rust module
LLM Analysis and Extensibility
XRefer ships with support for Gemini through a modular provider system. The architecture is designed for extensibility—new LLM providers can be added by implementing a simple interface that handles model-specific requirements like rate limiting and token management. It should be noted that cluster analysis, especially for large binaries, requires large context windows, an area in which Gemini models excel compared to other models.
Similarly, the prompt system is built to be extensible. New prompts can be easily added by creating prompt templates and corresponding response parsers. This allows XRefer’s analysis capabilities to grow as new use cases are identified or as LLM technology evolves.
It’s important to note that XRefer currently limits its LLM analysis to artifacts and function/cluster relationships (in the form of call flows) without submitting any actual code. For example, when analyzing a network communication module, XRefer provides the LLM with a rich set of artifacts like API calls (send, recv), strings (URLs, User-Agents), dynamic API traces, capa matches (network communication, socket operations), library/crate information, and their relationships in the call graph, rather than the underlying implementation code. This is just one simplified example. The actual analysis encompasses the full spectrum of artifacts XRefer collects.
The effectiveness of this approach depends on the successful extraction of these artifacts, whether through specialized language modules, internal binary analysis, or ingestion of external data sources. When artifacts are available, the Gemini-powered analysis effectively breaks down binary functionality into distinct functional units, providing an explorable architectural view of the binary. Code-level analysis represents the next logical step in XRefer’s evolution.
Path Analysis: The Foundation of XRefer’s Navigation
XRefer’s architecture is fundamentally entrypoint-centric. It constructs execution paths between entry points and functions containing artifacts, forming the backbone of both its clustering algorithm and the context-aware navigation capabilities described earlier. While clustering can be implemented without path analysis, our current approach of path-based clustering consistently produces decent results. Standalone clustering may come as a feature later down the road.
While entry point selection for PE executables is straightforward and automatic, DLL analysis may require analysts to select specific exports as starting points, since the default entry point might not be the most interesting one. XRefer allows analysts to analyze multiple entry points, providing flexibility in how they approach the binary.
Path analysis introduces computational overhead, but the benefits it provides to both navigation capabilities and clustering accuracy make this trade-off worthwhile. It’s important to note that this overhead is entirely front-loaded into the initial processing phase. Once analysis is complete, the pre-processed results ensure fluid navigation and responsiveness during actual usage. Table 4 shows what analysis times look like for several large binaries.
Table 4: Analysis-time listing for an arbitrary set of binaries
Note: Times include LLM queries for artifact discovery and cluster analysis. Actual duration varies based on system capabilities and binary complexity—from seconds for simple binaries to longer for complex ones. This listing aims to provide a general sense of expected time scales.
A notable limitation of path analysis arises in binaries with numerous indirect calls, where complete coverage cannot be guaranteed without proper resolution of these indirect targets.
Configuration
All LLM configurations and paths for external data sources can be managed through XRefer’s settings dialog.

Figure 16: XRefer settings dialog box
XRefer supports the ingestion of indirect cross-references that IDA cannot resolve statically. Examples can include dynamically resolved addresses for indirect calls, such as virtual function calls through vtables in C++ binaries and function pointer calls. These resolutions can be imported from sources like debugger scripts or binary instrumentation frameworks, enabling XRefer to construct more complete execution paths.
UI/UX and Compatibility
XRefer is implemented as an interactive TUI (Text-based User Interface) plugin. While IDA’s simplecustviewer_t wasn’t designed to be a proper TUI system, additional Qt implementations have been added to improve the interface. Users may encounter bugs, which will be addressed as they are reported.
Some rules of thumb when working with XRefer:
-
All addresses, regardless of where they are displayed in the TUI, are navigable by double clicking.
-
Cluster IDs (
cluster.id.xxxx), regardless of where they show up in the TUI, are also explorable by single clicking. -
If an address is the start of a function, hovering over it will always display an information pop-up about that function.
-
Hovering over cluster IDs will display a pop-up with details about that cluster.
-
Press ESC to return to the previous location/state (unless a graph is explicitly “pinned”).
XRefer maintains state within the current function and resets upon navigation to a new function. For detailed usage instructions and key bindings, please refer to the XRefer repository.
It is recommended to enable auto-resizing, which automatically adjusts XRefer’s window dimensions when viewing graphs and restores default size upon exit. While XRefer is designed to remain open as a persistent companion view, it includes an expand/collapse feature for quick access when needed. Figure 17 demonstrates these interface elements.
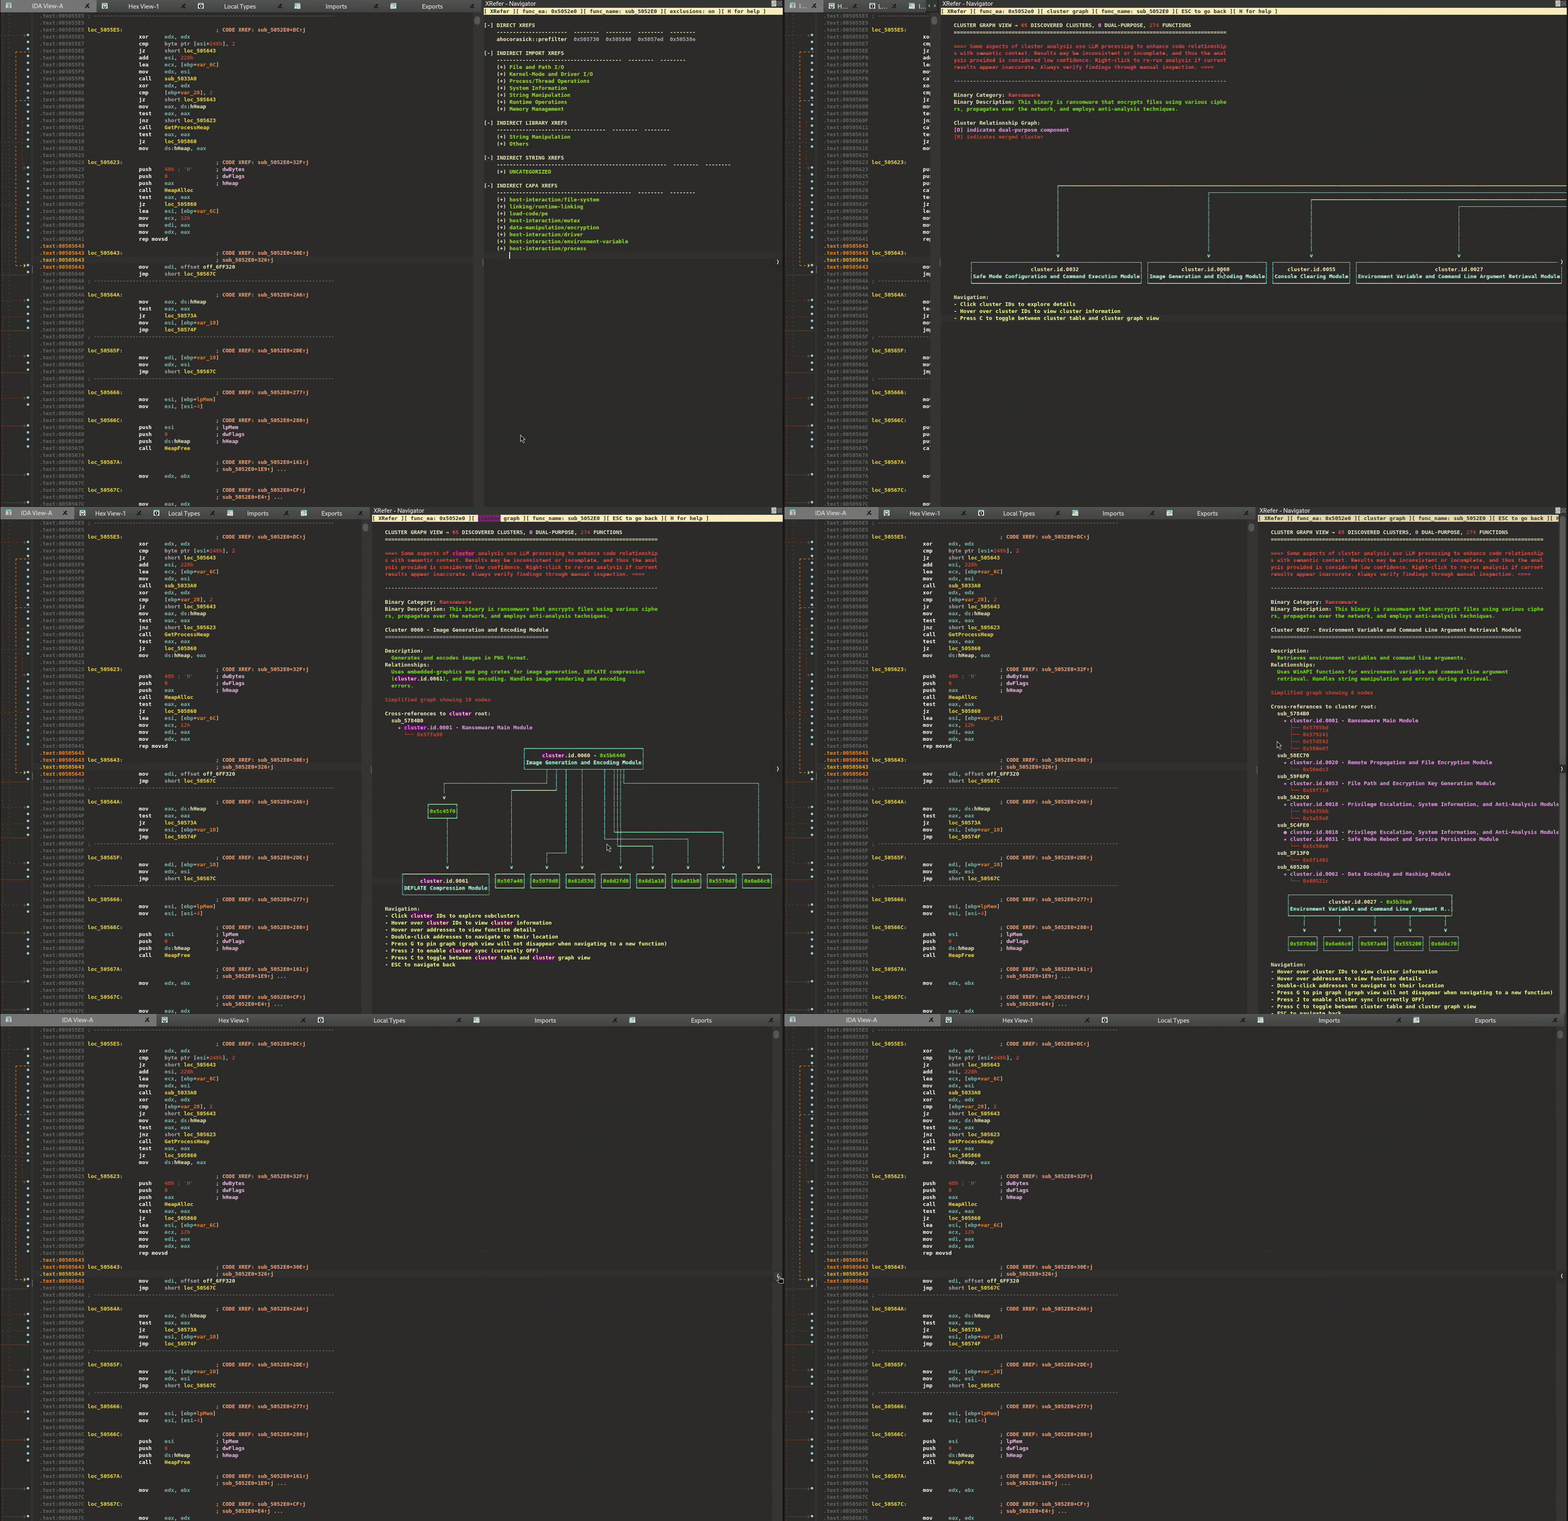
Figure 17: Auto-resizing and widget collapse/expansion
XRefer is recommended for use with either IDA <= 8.3 or IDA >= 9.0. IDA 8.4 contains a simplecustviewer_t visual bug that causes washed-out colors in several areas. Due primarily to the author’s preference for dark mode, the plugin currently provides better color contrast in dark themes compared to the default theme, though this may be balanced in future releases.
XRefer has been primarily tested with Windows binaries. While there are no fundamental limitations preventing support for ELF or Mach-O formats and XRefer may just work out of the box with most of them, some tweaks or implementation fixes might be required to ensure proper support.
How to Get XRefer
XRefer is now available as an open-source tool in Mandiant’s GitHub repository. Installation requires installing Python dependencies from requirements.txt and copying the XRefer plugin to IDA’s plugin directory.
Note that one of the dependencies, asciinet, requires Java (JRE or OpenJDK) to be configured on your system. For detailed installation instructions, please refer to the XRefer repository.
Another alternative is to use FLARE-VM, which sets up a reverse engineering environment with a lot of useful tools, including XRefer.
Future Work
This is the initial release of XRefer and thus includes some implementations that are early in their maturity. While LLMs may eventually evolve to accurately interpret all forms of source and compiled code, the current approach focuses on systematic analysis rather than treating LLMs as a black box for binary summarization. This methodology not only provides high-level insights but actively supports analysts in their detailed investigation workflows.
Immediate areas for future development include, beyond bug fixes and UI/UX refinements:
-
Extend cluster analysis to include code submissions, improving not just analysis at scale but also providing targeted insights for manual reverse engineering workflows
-
Research and potentially implement path-independent clustering methodologies (the primary benefit here would be speed improvements if path analysis is not required)
-
Implement LLM-based cluster merging (helps neatly tuck away similar clusters such as those belonging to a library)
-
Ensure proper support for non-Windows file formats
-
Add support for other language modules, particularly Golang
Currently, XRefer is tightly coupled with IDA due to its TUI implementation. As the core matures, the processing engine may be decoupled into a standalone package.
Acknowledgements
Special thanks to Genwei Jiang and Mustafa Nasser for their code contributions to XRefer and to Ana Martinez Gomez for including XRefer in the default FLARE-VM configuration. Additional thanks to the FLARE team members who provided valuable feedback through their use of XRefer.

