Monitoring API performance is crucial for user experience, business protection, and proactive issue resolution. To understand API performance, you need to understand key metrics like response time, throughput, error rate, latency, and availability. Poor performance can lead to user frustration, lost business, and damage to a company’s reputation, making optimization of these metrics essential.
The custom reports feature of Apigee API Management offers a powerful way to slice and dice your API analytics data, giving you highly tailored insights into your API program. These reports are beneficial for all API stakeholders — business, platform, and development teams — empowering them to make data-driven decisions to enhance API performance monitoring. By focusing on API metrics like request endpoints, response codes, or error types, Apigee’s custom reports can pinpoint bottlenecks and anomalies, leading to quicker issue resolution. The ability to aggregate data over custom time periods further facilitates trend analysis, capacity planning and correlation of performance with specific events, enhancing overall monitoring strategies.
As part of this blog, we’ll explore key custom reports to troubleshoot production deployments, optimize performance, and enhance your overall API strategy. The primary audience are platform, operation or development teams who monitor the platform on a regular basis. These custom reports serve as a foundation that you can adapt and expand for various troubleshooting scenarios.
Understanding Apigee Custom Reports
Apigee offers up to 14 months of API analytics data retention (depending on the Subscription Entitlements), providing valuable historical insights. Out-of-the-box API monitoring dashboards and custom reports complement each other as critical components of the Apigee API monitoring journey. While the pre-built dashboards offer useful insights at the environment and API proxy levels, custom reports provide greater depth and flexibility.
With custom reports, retrieve data parameters specific to an API traffic and relevant to specific teams or purposes. Apply filters using a variety of dimensions and aggregate the filtered data (sum, average, etc.) for meaningful interpretations. For example, an operations team might want to identify which request URI within a specific API proxy and target host is receiving the most traffic. Additionally, you can incorporate custom API data points from collector resources for an even deeper and more tailored analysis.
There is a wide range of flexibility when creating custom reports, experimenting with different dimensions and metrics. For example, Target host is a recommended dimension in all reports than Target IP1 as it makes analysis much easier. Hosts or FQDNs are simpler to remember than IP addresses, and these allow custom reports to capture traffic paths separately when multiple destinations are reached from a single target IP. Other useful dimensions as highlighted in reports are proxy base path, request URI, user agent, client IP, api product, developer app, geographical location etc.
Key custom reports
These are discussed in detail in the following sections.
1. Latency analysis
Latency analysis helps identify bottlenecks and delays in systems or networks. It is useful in optimizing performance and improving the overall user experience.
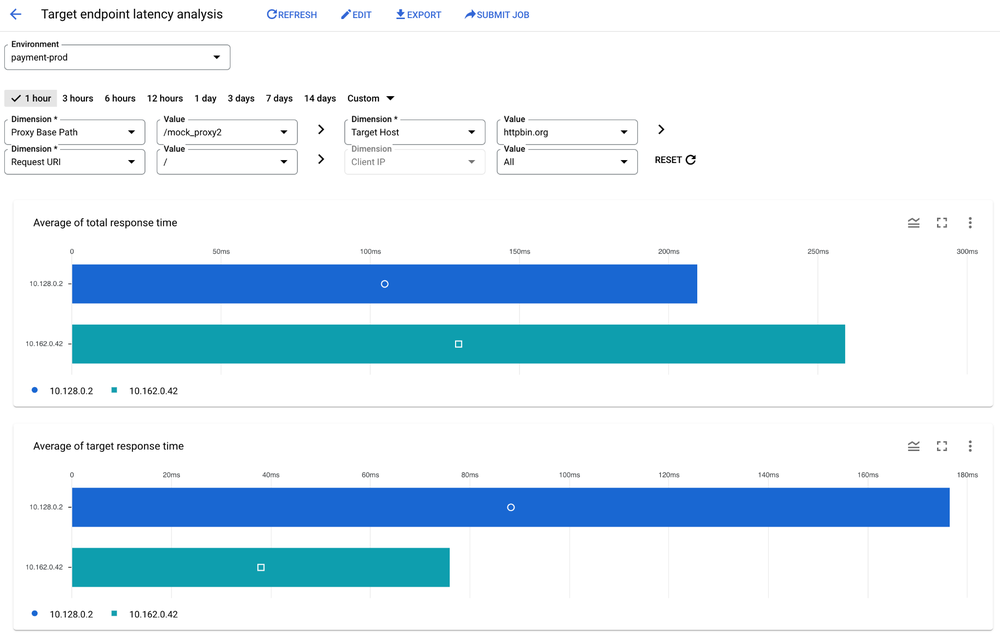
In Apigee, having multiple target backends for a single proxy makes troubleshooting latency issues difficult. Custom reports help to derive latencies according to specific target endpoints with dimensions such as Target Host, Request URI and Client IP. This allows you to quickly identify the specific backends or specific request URIs causing the high latency and simplifying the debugging process. Client IP address as a dimension helps pinpoint the source of slowness for specific application users and aids in troubleshooting whether the issue lies within their local network, ISP, or on the route to the API server.
To create a report for latency analysis for target endpoints, follow these steps:
-
Select the metrics as avg(total response time) and avg(target response time)
-
Select the dimensions as Proxy Base Path, Target Host, Request URI and Client IP
-
Apply Filter to reduce the number of entries
-
Run the custom report for the time duration
Here are the screenshots of a sample custom report:
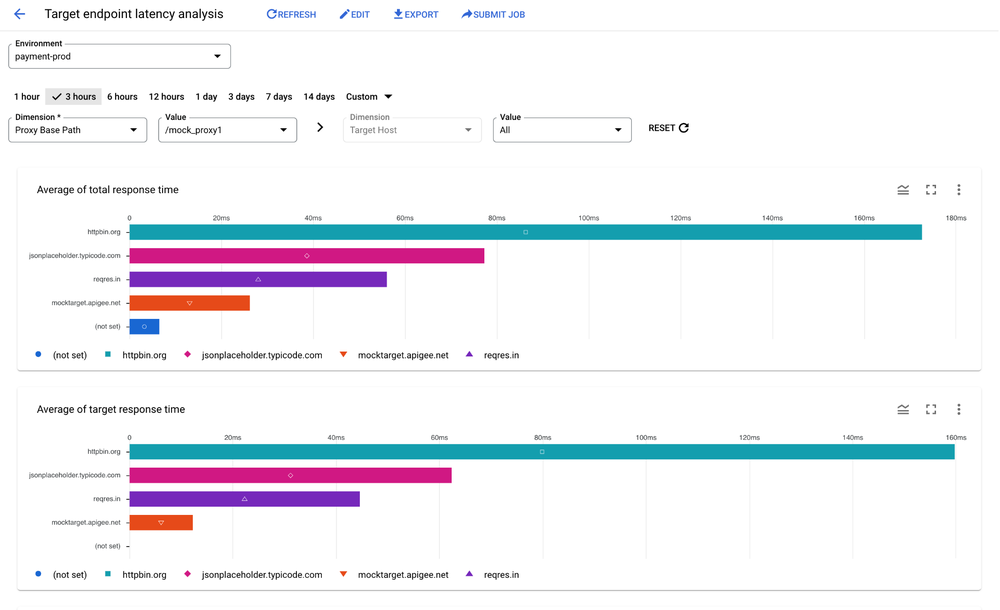
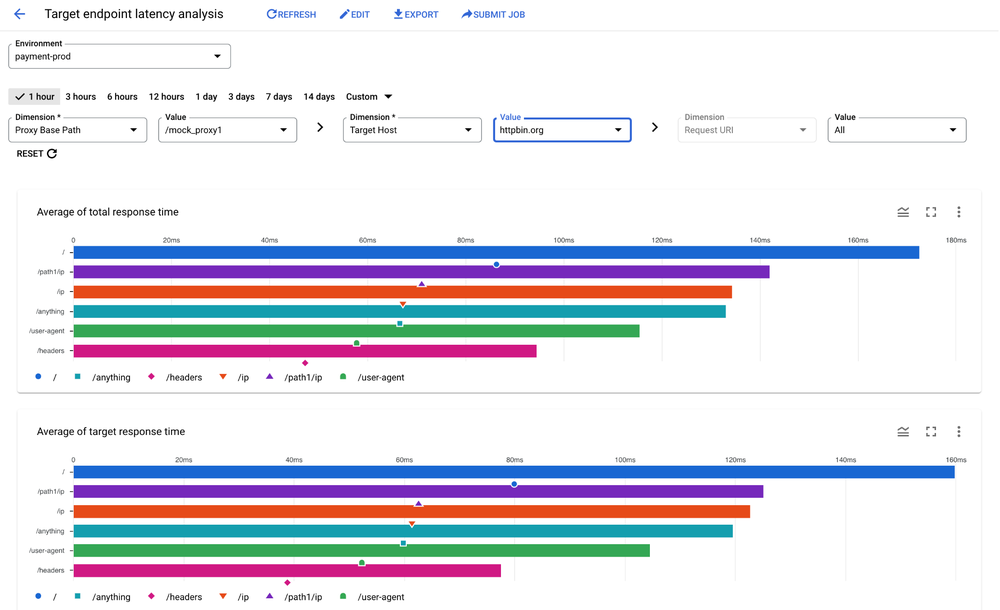
To further refine the analysis, Target Host and Request URI are selected. Target Hosts allows for filtering Target Endpoints within an API Proxy causing high latencies. With the Request URI filter, you troubleshoot issues related to individual API requests having high latency. Specific request URIs handling large payloads or complex operations might signal high latency and need to be troubleshooted further. The screenshot below shows a sample report with Request URI as the third dimension:
Client IP is added as a dimension to troubleshoot client specific issues. The screenshot below shows a sample report with Client IP as the fourth dimension:
2. Response code analysis
Response code analysis is important because it provides a rapid overview of API health and user experience. Response codes (e.g. 200 OK, 404 Not Found, 500 Internal Server Error) immediately signal success or failure. Analyzing response codes enables proactive fixes and optimizations, ultimately improving the reliability of your APIs.
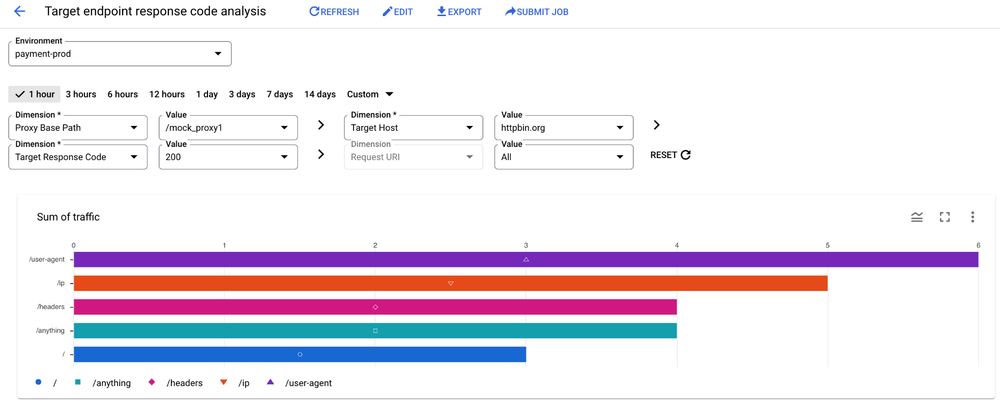
This reports filters using dimensions such as Target Hosts, Request URI and Target Response Code. It reveals error trends, pinpoints issues within backend systems, and highlights requests where errors are frequent.
To create a response code analysis report, follow these steps:
-
Select the metrics as sum(traffic)
-
Select the dimensions as Proxy Base Path, Target Host, Request URI and Target Response Code
-
Apply Filter to reduce the number of entries
-
Run the custom report for the specified time
Here are the screenshots of a sample custom report:
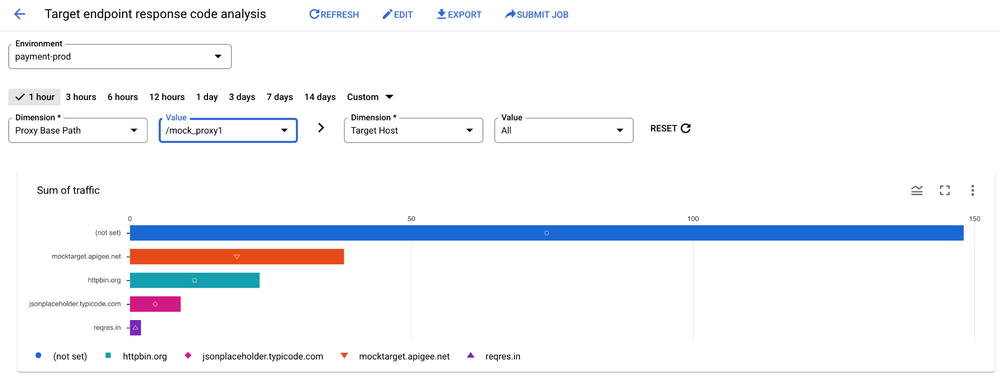
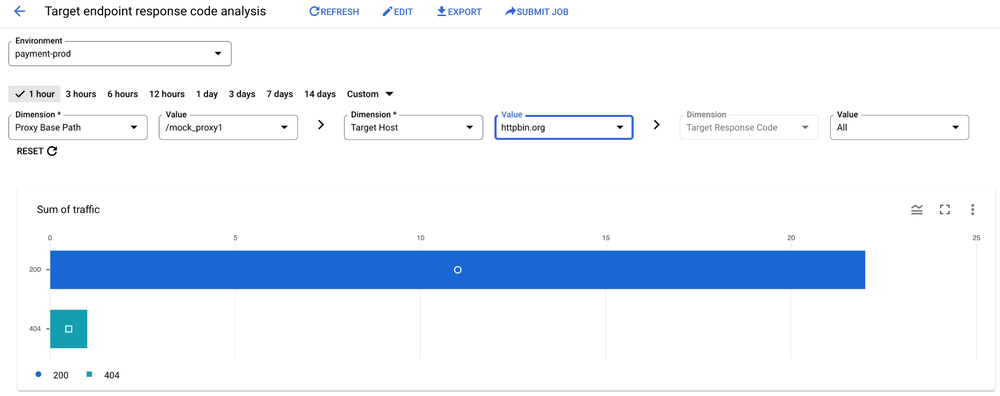
The below screenshot shows a sample report with Request URI as another dimension:
3. API product performance analysis
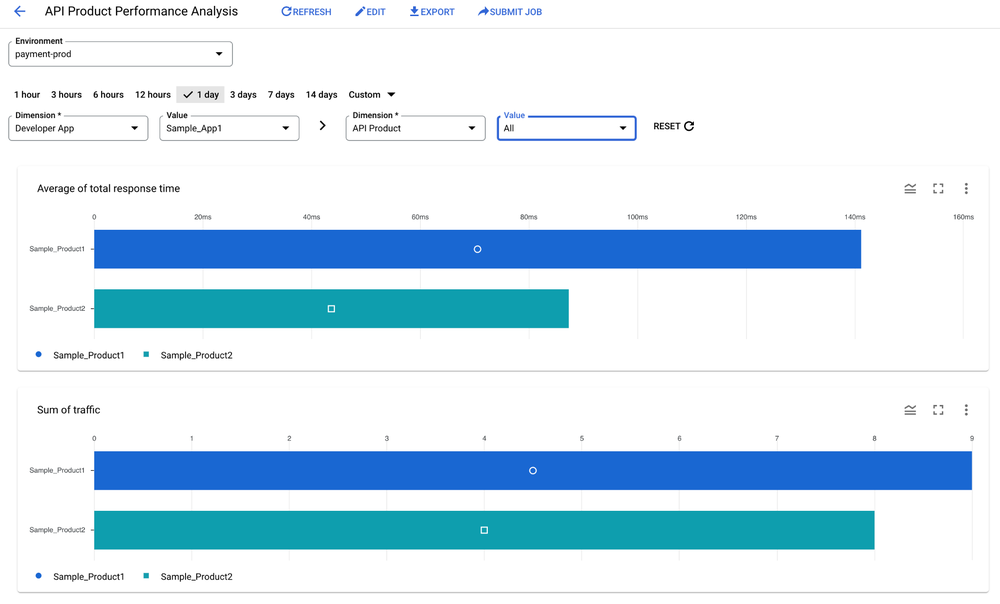
The report provides detailed and actionable insights for API product performance for each developer app/client IP and provides the following features.
-
Fine-grained troubleshooting for developer applications: The combination of dimensions like API Product, Developer App, Request URI, and Response Status Code pinpoints exactly where and under what conditions errors are occurring. This eliminates broad guesswork in problem resolution for specific API customers.
-
Client-focused insights: Developers or clients are the primary stakeholders consuming API products. The “Client IP Address” dimension helps isolate errors related to individual clients, highlighting potential network issues or misconfigurations on the consumer end.
-
Performance and error correlation for API product users: By including “avg(total response time)” alongside error metrics, you explore whether slow responses contribute to errors or if errors are impacting overall API performance.
To create a Response Code Analysis report for app developers, follow these steps:
-
Select the metrics as sum(traffic), and avg(total response time)
-
Select the dimensions as Developer App, API Product, Proxy Base Path, Target Host, Response Status Code, Client IP Address
-
Apply Filter to reduce the number of entries
-
Run the custom report for the specified time
Here are the screenshots of a sample custom report:
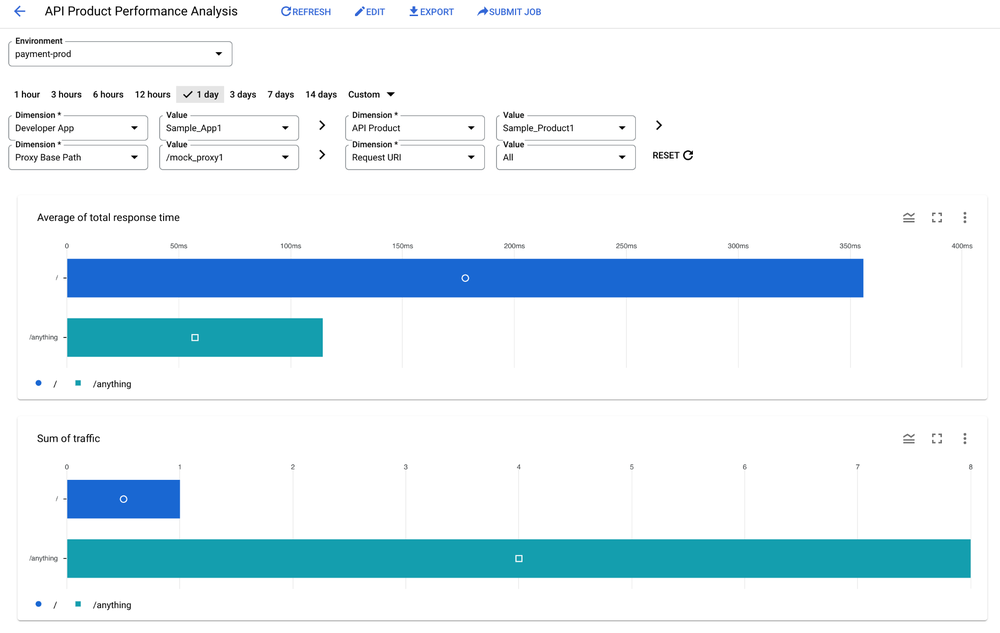
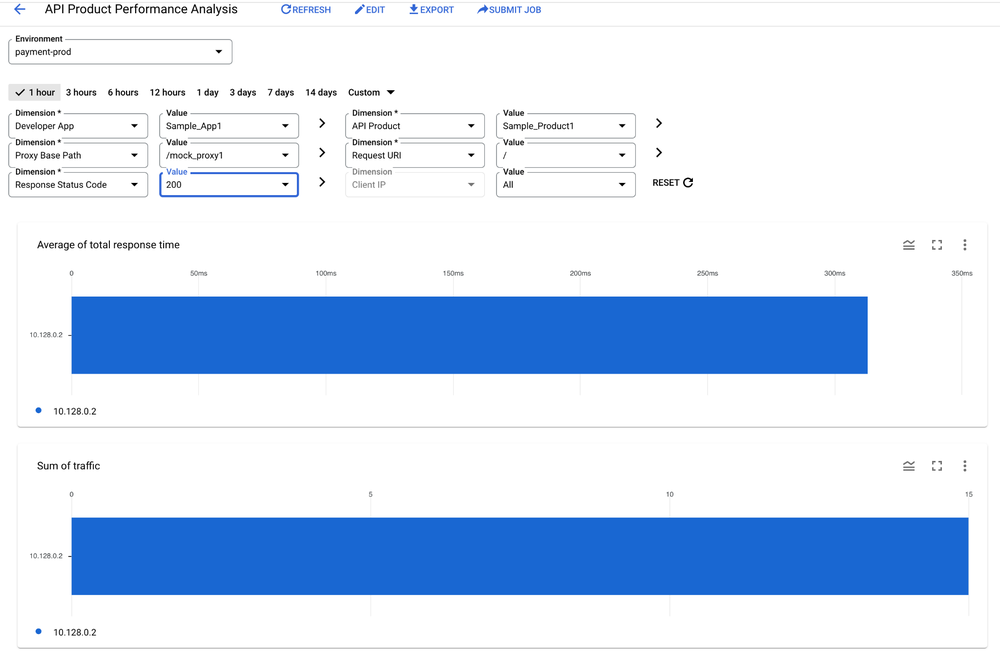
4. Cache-hit analysis
Cache-hit analysis is required to understand how well your caching system at Apigee is performing and helps in improving API speed for a better user experience. It gives the cache-hit value for Apigee cache which is an important parameter when evaluating caching systems. Using the custom reports, you have a granular view of Apigee cache performance with dimensions such as Request URI and metrics as Cache Hit and Total Traffic.
To create a Cache Hit Analysis report, follow these steps:
-
Select the metrics as sum(cache hit) and sum(traffic)
-
Select the dimensions as Proxy Base Path and Request URI
-
Apply Filter to reduce the number of entries
-
Run the custom report for the specified time
Here are the screenshots of a sample custom report:
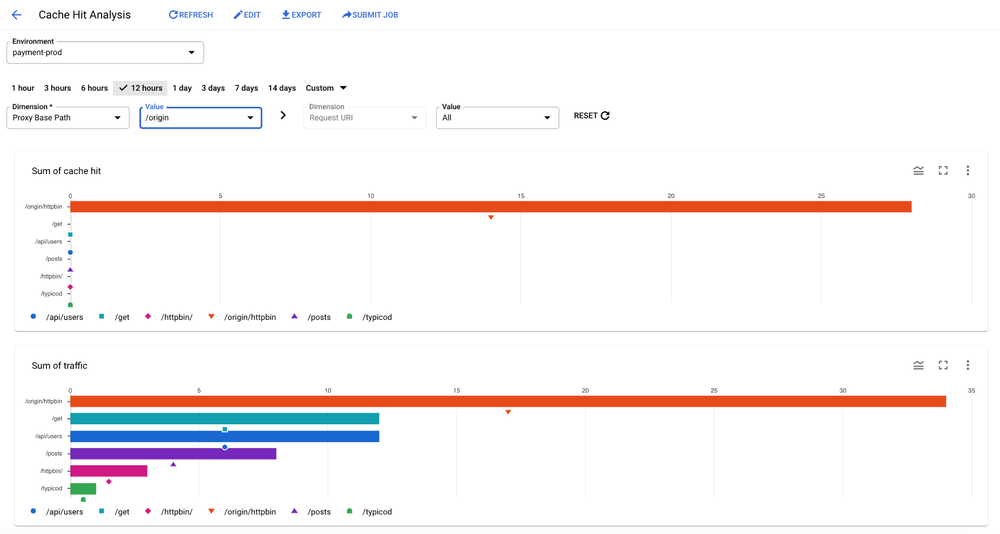
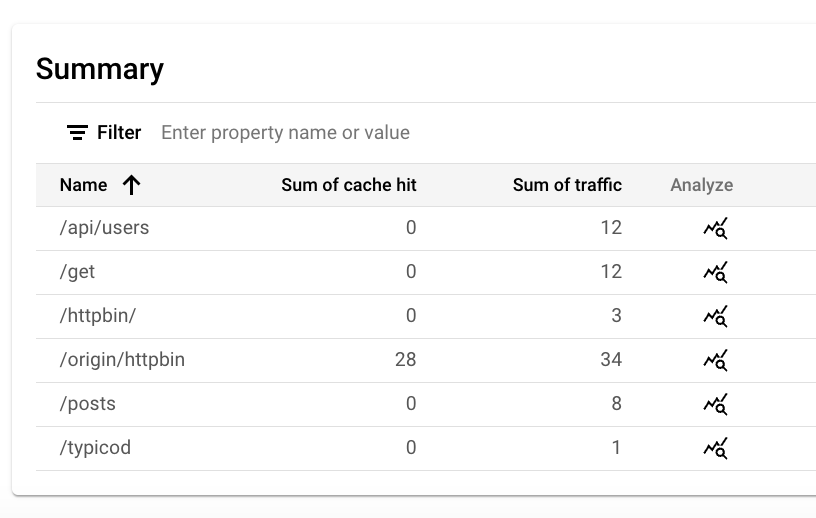
To view the cache performance for a particular Request URI within an API proxy, select the Request URI dimension for the dropdown and generate the custom report.
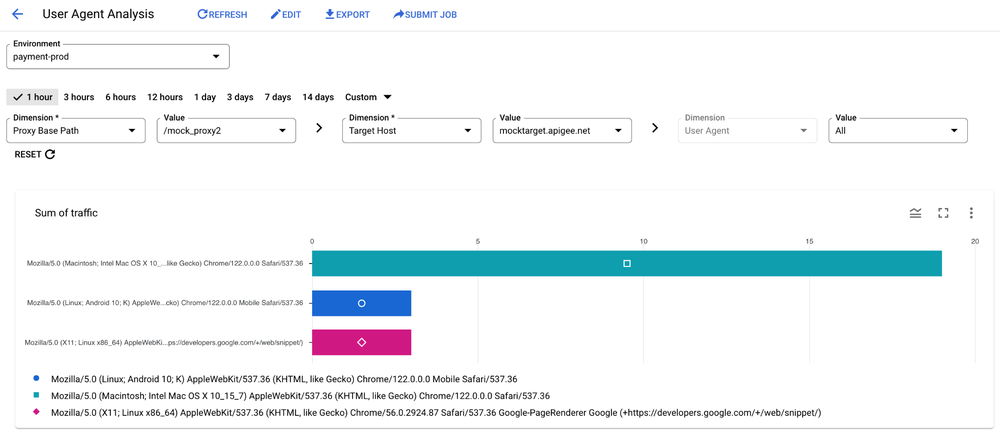
5. User agent analysis
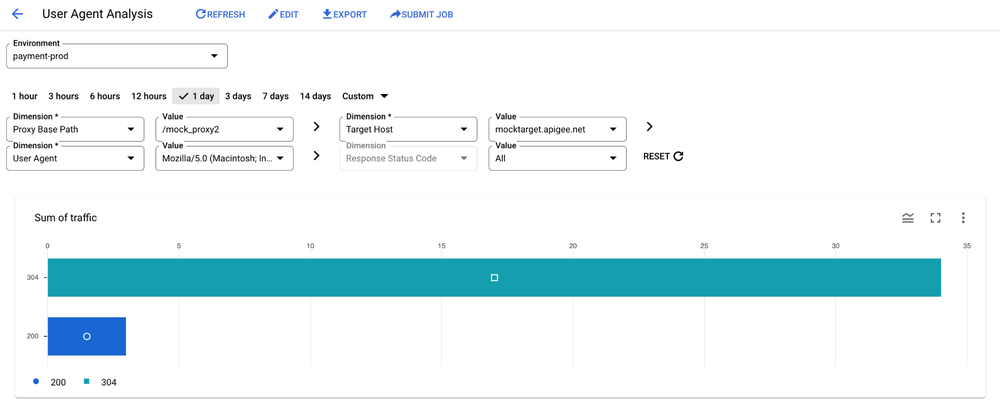
User agent analysis in Apigee is essential because it reveals the devices, browsers, and operating systems your API consumers are using. This information helps pinpoint device- or browser-specific compatibility issues, aids in debugging errors by providing detailed logs, allows for tailored API responses to improve user experience, and assists in identifying malicious bots or unusual activity for security purposes.
To create a User Agent Analysis report, follow these steps:
-
Select the metrics as sum(traffic)
-
Select the dimensions as Proxy Base Path, Target Host and User Agent/User Agent Family/User Agent Type and Response Code
-
Apply Filter to reduce the number of entries
-
Run the custom report for the specified time
Here are the screenshots of a sample custom report:
6. API-location analysis
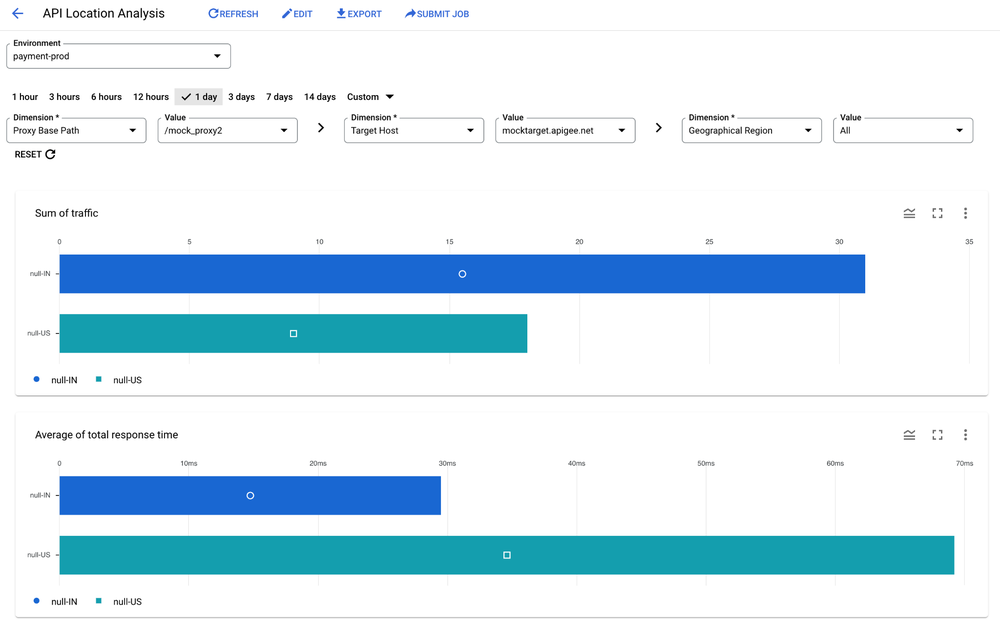
API-location analysis per request URI is required to understand the geographical origin of the traffic hitting specific endpoints of your API. It helps identify errors specific to certain regions (potentially caused by network issues or regional disruptions), isolate performance problems related to distance, ensure your API delivers the right localized content, and even contribute to fraud detection by flagging unusual location patterns. This analysis also has advantages for performance optimization (like content delivery and resource placement), adherence to data privacy regulations, localized troubleshooting, proactive capacity planning, and making informed marketing decisions based on regional API usage patterns.
To create a Cache Hit Analysis report, follow these steps:
-
Select the metrics as sum(traffic) and avg(total response time)
-
Select the dimensions as Proxy Base Path, Target Host and Geographical Region
-
Apply Filter to reduce the number of entries
-
Run the custom report for the specified time
Here are the screenshots of a sample custom report:
Accessing custom reports
Report Retrieval Method from Google Cloud Console:
1. Navigate to custom report feature in UI
-
With your saved report, retrieve custom data
-
Select the environment and time period, and view the selected metrics grouped by your chosen dimensions.
2. (For Shorter Duration) Download the report from UI in real time
-
-
Click on ‘Export’ to download the report in csv format
-
(Optional) Open the csv file in your spreadsheet software
-
3. (For Longer Duration) Asynchronously generate the report using report job
-
-
Click on Submit Job
-
Select the environment and time period, and view the selected metrics grouped by your chosen dimensions and click on Create.
-
Click on Report Jobs to download the report once Job is completed
-
Open the CSV in your spreadsheet software
-
Please refer to the documentation for selection criteria for real time vs report jobs.
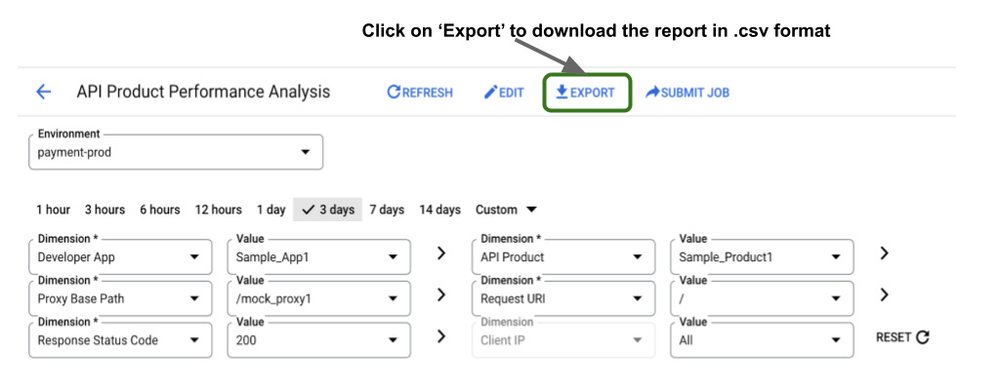
Here is screenshot of a sample downloaded report that was imported to Google Sheets:

Alternatively, use Apigee management APIs to create and access custom reports.
Quick recap on report creation from UI
Follow the steps below to create a new custom report:
-
Visit https://apigee.google.com/organizations/<project-name>/analytics/custom-reports. Click on ‘+Custom Report’.
-
Enter the report name and report description under the respective fields.
-
Select the desired metrics to be recorded. Select the aggregate function to be performed over the metrics.
-
Select one or more dimensions in sequence starting from proxy to specific resources scoped within the proxy
-
Use filters to limit results to metrics that meet particular conditions. This is an optional step.
-
Once all the parameters are selected, save the report.
Track API performance with custom reports
Custom reports is a versatile feature within the Apigee platform, offering in-depth, flexible analytics to track API performance and cater to the needs of various stakeholders. To get started, use the custom report feature within Google Cloud console or use Apigee management APIs. Explore Looker Studio Integration for enhanced visualization and analysis capabilities.
Ready to learn more? Explore how the experts from Google Cloud Consulting can help you get the most out of your APIs with Apigee and discover how Google Cloud Consulting can help you learn, build, operate and succeed.
1. Although Target Server Analysis over IP addresses are available out-of-box, their utility may be limited in scenarios such as ASM deployments with Apigee where a single Target Server IP supports multiple microservices.

