Chromebooks hold 60.1% of the global education device market as of 2025, making them the dominant computing platform in K-12 schools worldwide. This article breaks down the latest Chromebook vs tablet education statistics, comparing market share, shipment volumes, vendor rankings, regional adoption, and cost data for 2025–2026.
Chromebook vs Tablet Education Statistics: Key Numbers
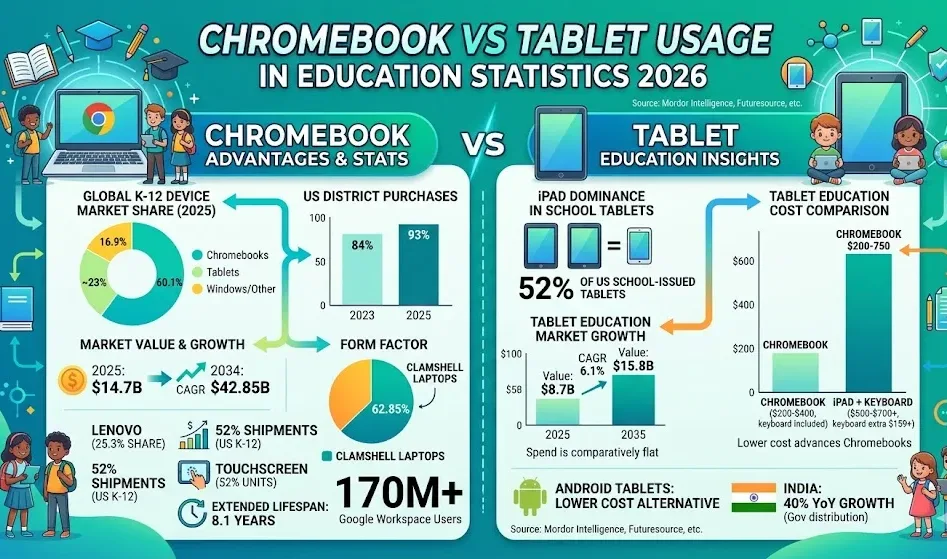
- Chromebooks account for 60.1% of the global K-12 device market in 2025, ahead of both Windows laptops and iPads.
- 93% of US school districts planned Chromebook purchases in 2025, up from 84% in 2023.
- The global Chromebook market reached $14.7 billion in 2025 and is projected to hit $42.85 billion by 2034.
- Apple shipped 19.6 million iPads in Q4 2025, yet Chromebook vendors collectively outship iPad in education-specific deployments.
- An estimated 43 million K-12 mobile PC units shipped globally in 2025, a 27% year-over-year increase.
How Do Chromebooks and Tablets Compare in Global Education Market Share?
Chromebooks control 60.1% of the global education device market, according to Mordor Intelligence. The education sector alone accounted for 57.70% of all Chromebook shipments in 2025. Tablets, including the iPad, represent roughly 23% of total K-12 device shipments by contrast.
Worldwide K-12 mobile PC shipments — notebooks, Chromebooks, and tablets combined — reached an estimated 43 million units in 2025, a 27% year-over-year increase driven largely by US refresh activity and Japan’s GIGA School Program, per Futuresource Consulting.
| Metric | Chromebooks | Tablets (incl. iPad) |
|---|---|---|
| Global education device market share (2025) | 60.1% | ~23% (est.) |
| US school district adoption rate (2025) | 93% plan to purchase | 52% of school-issued tablets are iPads |
| Global K-12 shipments (2025 est.) | 22.11 million units | Part of 43M total K-12 mobile PCs |
| Fastest-growing form factor CAGR | Chromebook tablets: 9.05% | Educational interactive tablets: 6.1% |
Source: Mordor Intelligence, Futuresource Consulting, WiseGuy Reports
Chromebook vs Tablet Market Value and Growth Rates
The Chromebook market was valued at $14.7 billion in 2025 and is on track to reach $42.85 billion by 2034, growing at a 12.62% compound annual growth rate, per Custom Market Insights. That’s roughly double the rate of the educational interactive tablet market, valued at $8.7 billion in 2025 and growing at just 6.1% CAGR through 2035.
The gap between these two growth rates is widening. Schools have largely shifted from pandemic-era emergency purchasing to planned refresh cycles, which has stabilized Chromebook demand across the sector while tablet spending in education remains comparatively flat.
| Metric | Chromebook Market | Tablet Education Market |
|---|---|---|
| Market value (2025) | $14.70 billion | $8.7 billion |
| Projected value | $42.85 billion by 2034 | $15.8 billion by 2035 |
| CAGR | 12.62% (2025–2034) | 6.1% (2025–2035) |
| Global shipments H1 2025 | 11 million units | Part of 38.3M total (all sectors) |
Source: Custom Market Insights, WiseGuy Reports, Futuresource Consulting
US School District Chromebook vs iPad Adoption Statistics
The jump from 84% to 93% of US districts planning Chromebook purchases between 2023 and 2025 reflects accelerating institutional commitment. About 70% of American schools use Google Workspace for Education products, per Proton, which creates an ecosystem alignment that makes Chromebooks the natural hardware choice in most procurement decisions.
Google Workspace for Education reached over 170 million students and educators across 230 countries by late 2025. The platform’s scale alone reinforces why districts with Google software investments keep choosing Chromebook hardware over iPads.
iPads hold 52% of school-issued tablets in the US, but that metric describes tablet-vs-tablet competition. When zooming out to all K-12 devices, Chromebooks carry 52% of US shipments while iPads represent a much smaller portion overall.
| Metric | Stat | Year |
|---|---|---|
| US districts planning Chromebook purchases | 93% | 2025 |
| US districts planning Chromebook purchases (prior) | 84% | 2023 |
| Chromebooks’ share of US K-12 device shipments | 52% | 2025 |
| iPad share of US school-issued tablets | 52% | 2025 |
| US schools using Google Workspace for Education | ~70% | 2025 |
| Google Workspace for Education global users | 170 million+ | 2025 |
| Districts funding Chromebooks via local/state budgets | 68% | 2025 |
Source: Mordor Intelligence, Accio, Proton, About Chromebooks
Chromebook vs Tablet Vendor Market Share in Education (2025)
Lenovo shipped 3.5 million Chromebooks in H1 2025, recording 27% year-over-year growth, per IDC. ASUS grew Chromebook shipments by 43% in the same period from a smaller base. On the tablet side, Apple shipped 19.6 million iPads in Q4 2025 alone — a 16.5% increase — maintaining its overall tablet market lead, per Omdia.
Apple’s iPad lead is strongest in the general consumer market. In education-specific deployments, Chromebook vendors collectively outship iPad by a wide margin. Understanding who uses Chromebooks by age group shows that 13–25-year-olds represent 59.8% of the market, driven almost entirely by K-12 and college institutional programs.
| Rank | Chromebook Vendor | Education Market Share | Top Tablet Vendor | Tablet Market Share |
|---|---|---|---|---|
| 1 | Lenovo | 25.3% | Apple (iPad) | 38.6% |
| 2 | HP | 21.5% | Samsung | 17.8% |
| 3 | Acer | 16.8% | Lenovo | ~8% |
| 4 | Dell | ~12% | Huawei | ~6% |
| 5 | ASUS | ~8% (43% YoY growth) | Xiaomi | ~5% |
Source: IDC Worldwide Quarterly Chromebook Tracker, Omdia
Chromebook vs Tablet Education Usage by Region
North America accounts for 52.4% of global Chromebook sales, with the US driving most of that volume. Asia-Pacific is the fastest-growing region at 4.7% CAGR. Japan’s GIGA School Program produced a twentyfold increase in Chromebook shipments year-over-year in H1 2025, with the Japanese government allocating roughly $2.2 billion to digital education infrastructure, per CommandLinux.
India’s tablet education demand grew 40% year-over-year driven by government distribution programs, per Maximize Market Research. That growth in Android tablets reflects a regional preference for lower-cost slate hardware in areas where Chromebook ecosystem infrastructure is still developing.
Chromebook global shipment data shows the US ChromeOS desktop share at 8.44% — more than four times its 1.86% global figure — a direct result of concentrated K-12 deployment.
| Region | Chromebook Market Share | Tablet Education Trend |
|---|---|---|
| North America | 52.4% of global Chromebook sales | Chromebooks dominate K-12; iPads hold tablet niche |
| Europe | ~32% of global Chromebook revenue | Growing adoption in UK, Germany, Nordics |
| Asia-Pacific | Fastest-growing at 4.7% CAGR | Strong Android tablet activity in South Korea, India |
| Latin America | Early-stage adoption | Government tablet projects in Brazil, Mexico |
Source: Mordor Intelligence, Futuresource Consulting, CommandLinux
Chromebook Form Factor Breakdown vs Tablet in Education (2025)
Clamshell laptops account for 62.85% of Chromebook shipments because schools value the built-in keyboard for typing-heavy tasks and standardized testing. Chromebook tablets are the smallest segment but growing at 9.05% CAGR — the fastest of any Chromebook form factor, per Mordor Intelligence.
Touchscreen-equipped Chromebooks already represent 52% of all units shipped, reflecting classroom demand for interactive use. The detailed Chromebook hardware breakdown shows early education grades favor compact 10–11 inch touchscreen models, while secondary schools typically run 14-inch clamshells for productivity work.
| Form Factor | Market Share (2025) | CAGR (through 2031) |
|---|---|---|
| Clamshell laptops | 62.85% | Baseline |
| Convertible 2-in-1s | ~14.8% | Moderate |
| Chromebook tablets | Smallest segment | 9.05% (fastest) |
| Touchscreen models | 52% of all Chromebooks | Growing |
Source: Mordor Intelligence
Chromebook vs iPad Cost Comparison in Education Procurement
A standard Chromebook ships at $200–$400 with keyboard, trackpad, and ports included. An iPad at $349 — after Apple’s May 2024 price cut from $449 — still requires a keyboard case at roughly $159 or more, pushing the per-student cost above $500. At district scale, that gap compounds into millions of dollars.
The shift to local and state funding — 68% of US districts now use those budgets for Chromebook purchases rather than federal allocations — further advantages the lower-cost device. You can see more on how schools manage device replacement cycles given these budget pressures.
Google’s own cost data shows Chromebooks carry a 55% lower device cost and 57% lower operational cost compared to Windows devices. An Intel field study found 90% fewer hardware-related service calls for ChromeOS versus legacy Windows configurations, per About Chromebooks.
| Device Category | Typical Education Price | Notes |
|---|---|---|
| Standard Chromebook | $200–$400 | Keyboard and ports included |
| Chromebook Plus | $349–$699 | Includes Gemini AI, better specs |
| Entry-level iPad | $349 | Requires separate keyboard (~$159+) |
| iPad with keyboard + case | $500–$700+ | Total cost for classroom-ready setup |
| Android education tablets | $150–$300 | Lower-cost but fragmented ecosystem |
Source: About Chromebooks, Apple Education Store
How Do Chromebooks Perform on Lifespan and Total Cost Over Time?
Education-sector Chromebooks now average 8.1 years of use in 2026, nearly double the pre-2024 school average of around four years, per About Chromebooks. Google’s extended 10-year Auto Update policy was the main driver of that change — schools that previously replaced devices when software support expired can now plan around physical wear instead.
The PIRG Education Fund estimated that doubling Chromebook lifespans across 48.1 million K-12 students could save $1.8 billion and reduce emissions equivalent to removing 900,000 cars from the road for a year. For districts evaluating fleet refresh timing, the Chromebook lifespan data by brand shows Lenovo recording the lowest five-year failure rate at 6.3%.
Only about one-third of expired Chromebooks are properly recycled, with the rest going to landfill. Chromebooks score just 3.3 out of 20 on France’s repairability index versus 9 out of 20 for comparable laptops, per the US PIRG Education Fund.
FAQ
What percentage of the global education device market do Chromebooks hold?
Chromebooks hold 60.1% of the global K-12 education device market as of 2025, according to Mordor Intelligence, making them the leading device category ahead of Windows laptops and iPads.
How many US school districts plan to buy Chromebooks in 2025?
93% of US school districts planned to purchase Chromebooks in 2025, up from 84% in 2023. Around 68% of those purchases are funded through local or state budgets rather than federal allocations.
Are iPads still widely used in schools?
iPads hold 52% of school-issued tablets in the US, but tablets as a whole represent a much smaller slice of total K-12 device shipments. Chromebooks carry 52% of all US K-12 device shipments by comparison.
Why are Chromebooks cheaper than iPads for schools?
A standard Chromebook costs $200–$400 and includes a keyboard. An iPad starts at $349 but requires a separate keyboard case, pushing the total above $500 per student. Google also reports 57% lower operational costs versus Windows devices.
Which Chromebook vendor leads in education shipments?
Lenovo leads with 25.3% market share and 3.5 million units shipped in H1 2025, recording 27% year-over-year growth. HP holds second at 21.5%, followed by Acer at 16.8%.