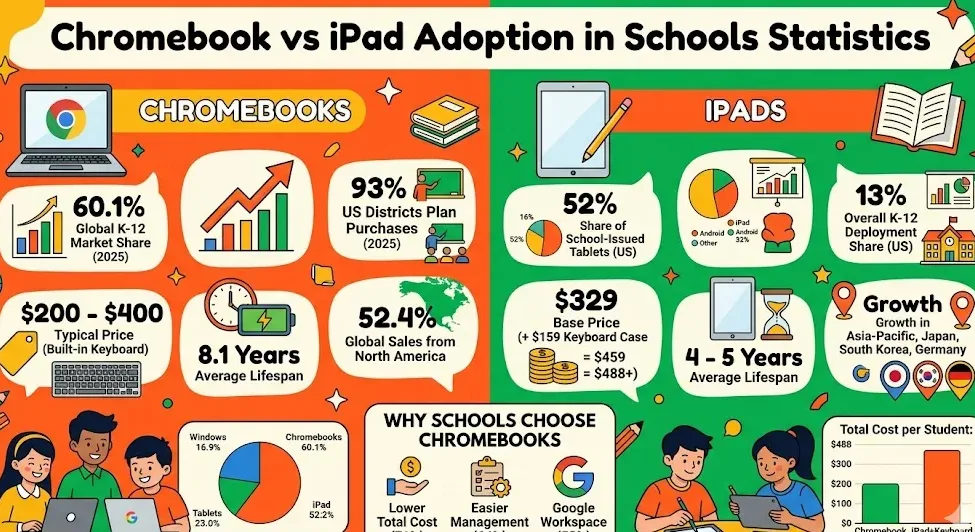
Chromebooks now control 60.1% of the global K-12 device market, while iPads hold around 13% of overall school deployments and 52% of school-issued tablets in the US. This article tracks the latest 2026 numbers on shipments, district purchasing, costs, and regional adoption that show where each platform stands in classrooms today.
Chromebook Vs iPad Adoption In Schools Statistics 2026 (Top 5)
- Chromebooks hold 60.1% of the global K-12 device market in 2025, ahead of Windows laptops and iPads.
- 93% of US school districts planned Chromebook purchases in 2025, up from 84% in 2023.
- iPads keep a 52% share of school-issued tablets in the US but only about 13% of overall device deployments.
- Education accounted for 57.7% of all Chromebook shipments in 2025.
- An estimated 43 million K-12 mobile PC units shipped globally in 2025, a 27% year-over-year jump.
Global Chromebook Vs iPad Adoption In Schools Statistics
Chromebooks lead the worldwide K-12 device market by a wide margin in 2025. Tablets, including iPads, account for roughly 23% of K-12 device shipments, while Windows laptops sit between the two.
| Device Category | Global K-12 Market Share (2025) |
|---|---|
| Chromebooks | 60.1% |
| Windows laptops | 16.9% |
| Tablets (incl. iPads) | 23.0% |
Source: Mordor Intelligence, Futuresource Consulting
How Many US Districts Buy Chromebooks Vs iPads?
The gap between Chromebook and iPad buying intent has widened in US districts. 93% of districts said they planned Chromebook purchases in 2025, up from 84% two years earlier. iPads remain a niche choice for elementary and special-education programs rather than 1:1 fleets.
| Year | US Districts Planning Chromebook Purchases |
|---|---|
| 2023 | 84% |
| 2024 | 89% |
| 2025 | 93% |
Source: About Chromebooks, IDC Worldwide Quarterly Chromebook Tracker
Chromebook vs iPad Vs Other Devices In US Districts
A separate breakdown of US district-level deployments puts Chromebooks far ahead of every other category. iPads tie with Windows desktops at the bottom of the four main platforms.
| Device | US School District Deployment Share |
|---|---|
| Chromebooks | 42% |
| Windows laptops | 15% |
| Windows desktops | 13% |
| iPads | 13% |
Source: Drew Smith / Automata Technology Services analysis citing Futuresource Consulting
Chromebook Vs iPad Cost Comparison For Schools
Cost is the single biggest reason districts pick Chromebooks. A standard Chromebook ships with a built-in keyboard for $200 to $400. The base iPad sells to schools at $329 after Apple’s May 2024 cut, but a keyboard case adds at least $159, pushing the per-student total above $500.
| Item | Chromebook (typical) | iPad (base + keyboard) |
|---|---|---|
| Device price | $200 – $400 | $329 |
| Required keyboard | Included | $159+ |
| Total per student | $200 – $400 | $488+ |
| Average lifespan in schools (2026) | 8.1 years | 4 – 5 years |
Source: About Chromebooks, Apple education pricing
iPad Share Of School-Issued Tablets In The US
When the comparison narrows to tablets only, iPads still lead. Apple holds 52% of school-issued tablets in the US, with Android tablets and Windows tablets taking the rest. iPad shipments came to 11.5 million units in Q1 2025, a 3.5% drop year-over-year, even as accessory revenue from keyboards and pencils crossed $1.2 billion in H1 2025.
| Tablet Brand | US School-Issued Tablet Share |
|---|---|
| iPad | 52% |
| Android tablets | 32% |
| Other | 16% |
Source: SQ Magazine, Accio, About Chromebooks
Chromebook Vs iPad Vendor Shipments
Lenovo shipped 3.5 million Chromebooks in the first half of 2025, with 27% year-over-year growth. ASUS posted the steepest growth at 43% from a smaller base. Apple shipped 19.6 million iPads in Q4 2025 alone (up 16.5%), but most of that volume goes to consumers rather than schools.
| Vendor | Units Shipped (H1 2025) | YoY Growth |
|---|---|---|
| Lenovo (Chromebook) | 3.5 million | 27% |
| HP (Chromebook) | 3.0 million | 14% |
| Acer (Chromebook) | 2.3 million | 11% |
| ASUS (Chromebook) | 0.8 million | 43% |
| Apple (all iPads, Q4 2025) | 19.6 million | 16.5% |
Source: IDC Worldwide Quarterly Chromebook Tracker, Omdia
Chromebook Vs iPad Adoption By Region
North America drives 52.4% of global Chromebook sales. Asia-Pacific is the fastest-growing region for both platforms at 4.7% CAGR, with Japan’s GIGA School Program generating a twentyfold year-over-year jump in Chromebook shipments in H1 2025. iPad penetration grew most in Germany and South Korea, contributing to a 7% rise in average selling price.
| Region | Chromebook Share | Notes On iPad Adoption |
|---|---|---|
| North America | 52.4% | iPad strongest in elementary and special-ed programs |
| Europe | 32.0% | iPad gains in Germany and the UK |
| Asia-Pacific | 10.3% | iPad growth in South Korea, Japan |
| Latin America & Africa | 5.3% | Limited iPad rollout, mostly private schools |
Source: Mordor Intelligence, About Chromebooks
Why Schools Choose Chromebooks Over iPads
School IT teams cite three things when explaining the gap: lower upfront cost, easier fleet management, and tighter alignment with Google Workspace, which now serves over 170 million students and educators across 230 countries. Google reports 57% lower operational costs versus Windows devices, and an Intel field study found 90% fewer hardware service calls on ChromeOS than on legacy Windows setups.
| Reason | Cited By IT Leaders (%) |
|---|---|
| Lower total cost of ownership | 71% |
| Easier device management | 64% |
| Google Workspace integration | 58% |
| Faster boot and login | 49% |
| Built-in keyboard | 41% |
Source: Google for Education, About Chromebooks
Chromebook Vs iPad Education Market Growth Forecast
The Chromebook market reached $14.7 billion in 2025 and is projected to hit $42.85 billion by 2034 at a 12.62% CAGR. The educational interactive tablet market sat at $8.7 billion in 2025 and is growing at 6.1% CAGR through 2035, less than half the Chromebook pace.
| Segment | 2025 Value | Projected Value | CAGR |
|---|---|---|---|
| Global Chromebook market | $14.7 billion | $42.85 billion (2034) | 12.62% |
| Educational tablet market | $8.7 billion | $15.7 billion (2035) | 6.1% |
Source: Custom Market Insights, WiseGuy Reports
For districts evaluating refresh timing, the best Chromebooks for students guide compares the models most commonly approved for K-12 fleets. Schools also lean on the Chromebook buying guide when choosing between Plus and standard models, and many planners review the Chromebook user statistics to benchmark fleet size against peers.
FAQs
What percentage of schools use Chromebooks vs iPads?
Chromebooks hold 60.1% of the global K-12 device market in 2025. In US districts, 42% deploy Chromebooks as the primary device while iPads sit at 13%. iPads still hold 52% of school-issued tablets specifically.
Are Chromebooks cheaper than iPads for schools?
Yes. A standard Chromebook costs $200 to $400 with a built-in keyboard. The base iPad costs $329 but needs a keyboard case at $159 or more, pushing per-student totals above $500. Chromebooks also carry 57% lower operational costs.
How long do Chromebooks last in schools?
Education-sector Chromebooks now average 8.1 years of use in 2026, up from around four years before Google extended automatic updates to 10 years in late 2023. iPads typically last 4 to 5 years in classroom settings.
Which Chromebook brand do schools buy most?
Lenovo leads with 25.3% of education Chromebook market share and 3.5 million units shipped in H1 2025. HP holds second at 21.5%, followed by Acer at 16.8%. ASUS posted the fastest growth at 43% year-over-year.
Is iPad still growing in K-12 schools?
iPad shipments fell 3.5% year-over-year in Q1 2025 to 11.5 million units globally. iPads keep a 52% share of school-issued tablets in the US, but Chromebook vendors collectively outship iPads in education-specific deployments.
Sources