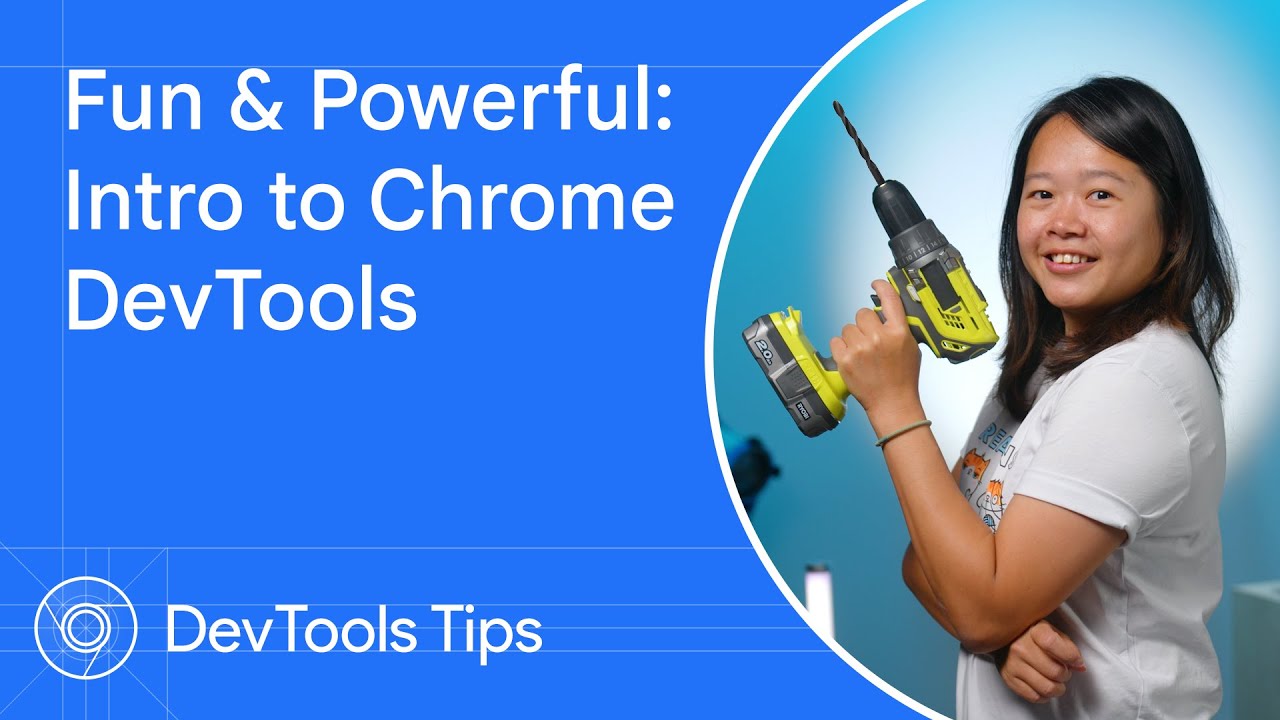
In this video, Jecelyn will walk you through the basics of getting started and tips for Chrome DevTools.
Chapters:
0:00 – Introduction
0:23 – Open Chrome DevTools
0:38 – 6 things to know as a beginner
0:47 – Inspect node – View the DOM elements
0:56 – Elements panel – Edit CSS
1:26 – Device mode – Simulate mobile views
1:38 – Console panel – View logs, errors and warnings
2:14 – Sources panel – Set breakpoints and debug program flow
2:58 – Console panel – Experiment with JavaScript
3:27 – Network panel – Filter network logs
4:17 – Network panel – Throttling network speed
Tips:
2:44 – Tip: Set up workspace to sync edits
3:13 – Tip: Use console shortcuts for quicker commands
3:50 – Tip: Select multiple network request types
4:39 – Tip: Customize DevTools based on your preference
Questions? Tweet to us:
Jecelyn Yeen → https://goo.gle/jecfish
Chrome DevTools → https://goo.gle/chromedevtools
Resources:
Getting started → https://goo.gle/devtools-overview
Open DevTools → https://goo.gle/devtools-open
The 6 features for beginner:
Inspect node → https://goo.gle/devtools-dom
Device mode → https://goo.gle/devtools-device-mode
Elements panel → https://goo.gle/devtools-css-issues
Console panel: https://goo.gle/devtools-console-api
Sources panel → https://goo.gle/devtools-breakpoints
Network panel → https://goo.gle/devtools-network
The extra productivity tips:
Customize DevTools → https://goo.gle/devtools-customize
Setup workspace → https://goo.gle/devtools-workspace
Console shortcuts → https://goo.gle/devtools-console-utils
Watch more DevTools Tips → https://goo.gle/DevToolsTips
Subscribe to Chrome for Developers → https://goo.gle/ChromeDevs
#ChromeForDevelopers #Chrome
Speaker: Jecelyn Yeen |
Products Mentioned: Chrome |

