
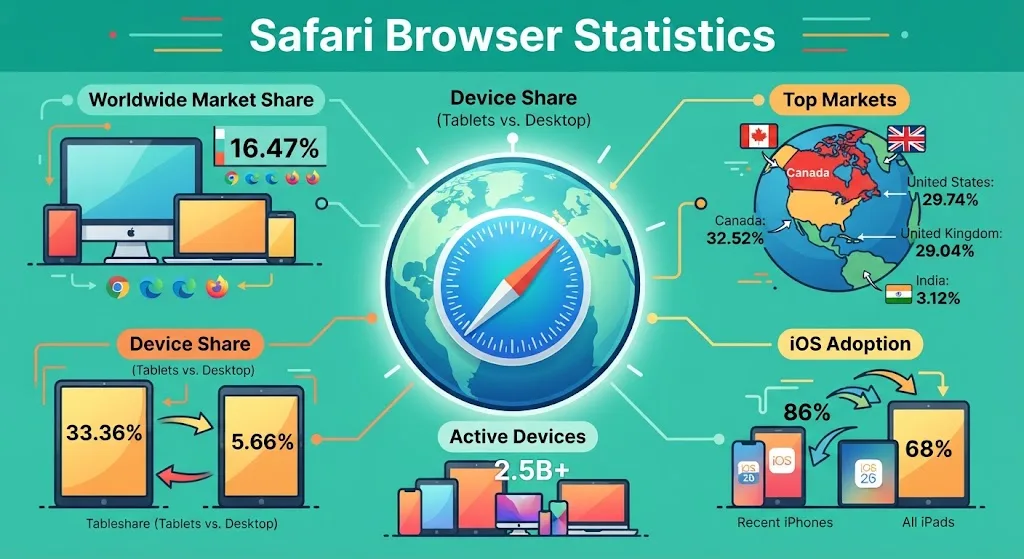
Safari took 33.36% of worldwide tablet page views in July 2026 and 5.66% of desktop page views in the same month, according to StatCounter. That gap between two device categories is the whole story of Apple’s browser: its reach follows Apple hardware, not downloads. This post covers Safari’s share by device, by country, its version adoption, and the Apple revenue line it sits inside.
Safari Browser Statistics
What Is Safari’s Browser Market Share Worldwide?
Safari ranked second worldwide in July 2026 with 16.47% of sampled page views. Chrome held 68.22%, more than four times Safari’s figure.
Edge, Firefox, Samsung Internet and Opera together sat below Safari. These are shares of page views measured across desktop, mobile, tablet and console traffic, not counts of people. Chrome’s side of the same panel is broken out in these Google Chrome statistics and user trends.
| Browser | Share of worldwide page views |
|---|---|
| Chrome | 68.22% |
| Safari | 16.47% |
| Edge | 5.37% |
| Firefox | 3.34% |
| Samsung Internet | 2.06% |
| Opera | 1.88% |
Source: StatCounter Global Stats, all platforms, July 2026
Safari Browser Statistics By Device Type
Safari’s share moves from 5.66% on desktop to 33.36% on tablets. It ranks second on tablet, mobile and all-platform traffic, and fourth on desktop.
On tablets, StatCounter reports Android traffic on a separate 14.11% line that Chrome’s 48.32% does not include. The device split for Chrome runs the other way, as set out in this breakdown of Chrome traffic across desktop, mobile and tablet.
| Platform | Safari | Chrome | Safari’s rank |
|---|---|---|---|
| Tablet | 33.36% | 48.32% | 2nd |
| Mobile | 25.44% | 66.79% | 2nd |
| All platforms | 16.47% | 68.22% | 2nd |
| Desktop | 5.66% | 70.58% | 4th |
Source: StatCounter Global Stats, share of page views, July 2026
Why Safari Ranks Fourth On Desktop
Edge recorded 11.15% of worldwide desktop page views in July 2026 and Firefox 6.51%. Both sit above Safari’s 5.66%.
Opera followed at 2% and Samsung Internet at 1.59%. Safari on desktop ships only with Macs, while Edge ships with Windows, which is the practical limit on Safari’s desktop reach. A platform where a single browser carries almost everything is covered in these Chromebook browser usage statistics.
| Desktop browser | Share of worldwide desktop page views |
|---|---|
| Chrome | 70.58% |
| Edge | 11.15% |
| Firefox | 6.51% |
| Safari | 5.66% |
| Opera | 2% |
| Samsung Internet | 1.59% |
Source: StatCounter Global Stats, desktop, July 2026
Safari Browser Statistics On Mobile
Safari recorded 25.44% of worldwide mobile page views in July 2026, second to Chrome at 66.79%. No other mobile browser cleared 3%.
Samsung Internet followed at 2.48%, Opera at 1.8% and UC Browser at 1.25%. Firefox recorded 0.67% on mobile, against 6.51% on desktop.
| Mobile browser | Share of worldwide mobile page views |
|---|---|
| Chrome | 66.79% |
| Safari | 25.44% |
| Samsung Internet | 2.48% |
| Opera | 1.8% |
| UC Browser | 1.25% |
| Firefox | 0.67% |
Source: StatCounter Global Stats, mobile, July 2026
Safari Browser Statistics By Country
Canada recorded 32.52% for Safari in July 2026, ahead of the United States at 29.74% and the United Kingdom at 29.04%. India recorded 3.12%, where Chrome took 89.18%.
Each row below is a share of page views inside that market. Chrome’s reach across the same countries is set out in this analysis of the global Chrome user base.
| Market | Safari | Chrome |
|---|---|---|
| Canada | 32.52% | 49.08% |
| United States | 29.74% | 51.42% |
| United Kingdom | 29.04% | 49.67% |
| Worldwide | 16.47% | 68.22% |
| India | 3.12% | 89.18% |
Source: StatCounter Global Stats, all platforms, share of page views in each market, July 2026
Edge placed third in the United Kingdom at 12.36%, higher than its 8.65% in Canada and 7.23% in the United States. In India, Opera took 3.76%, ahead of Safari.
How Many iPhones Run The Latest Safari Version?
Safari updates ship with iOS, so its version spread matches Apple’s operating system adoption. Apple measured 79% of all iPhones transacting on the App Store on 7 June 2026 running iOS 26, and 86% of iPhones introduced in the previous four years.
iPad numbers run lower. Apple counted 68% of all iPads on iPadOS 26 and 79% of iPads released in the last four years. These figures describe devices that transacted on the App Store on a single day, not the full installed base.
| Device group | Running the 26 generation |
|---|---|
| iPhones introduced in the last four years | 86% |
| All iPhones | 79% |
| iPads introduced in the last four years | 79% |
| All iPads | 68% |
Source: Apple Developer, devices that transacted on the App Store on 7 June 2026
Safari Browser Statistics Behind Apple’s Services Revenue
Apple reported Services net sales of $30,739 million for the quarter ended 27 June 2026, against $27,423 million in the quarter ended 28 June 2025. Total net sales were $109,417 million, up 16% year over year.
Google’s payments for Safari’s default search placement sit inside that Services line and are not broken out by Apple. Apple also reported quarterly revenue of $143.8 billion for the quarter ended 27 December 2025, when Tim Cook said the installed base had passed 2.5 billion active devices.
| Category | Quarter ended 27 Jun 2026 | Quarter ended 28 Jun 2025 |
|---|---|---|
| Services | $30,739M | $27,423M |
| iPhone | $54,252M | $44,582M |
| Mac | $10,352M | $8,046M |
| iPad | $6,191M | $6,581M |
| Total net sales | $109,417M | $94,036M |
Source: Apple, Condensed Consolidated Statements of Operations, fiscal 2026 third quarter
The Google Default Search Deal
The final judgment in the United States search antitrust case was entered on 5 December 2025. Judge Amit Mehta let Google keep paying for default placement but barred exclusive contracts and required that any such agreement terminate no more than one year after it is entered.
Google cannot condition revenue share on keeping a Google service as the default beyond one year. The Department of Justice and a group of states filed a cross-appeal in February 2026, and Google appealed separately. Safari’s 16.47% of worldwide page views is what Apple brings to each annual renegotiation, and the 5.66% desktop figure explains why that number sits below Apple’s device count. For the mobile side of the same market, see how Chrome’s mobile share has moved since 2021 and the wider Chromebook shipment and market data.
FAQs
What is Safari’s market share in 2026?
Safari held 16.47% of worldwide browser page views across all platforms in July 2026, according to StatCounter. Chrome led with 68.22%. Safari ranked second overall.
Reddit threads often ask whether Safari beats Chrome on iPhone. What does the data show?
StatCounter’s mobile line covers all phones, not iPhones alone. In July 2026 Chrome took 66.79% of worldwide mobile page views and Safari 25.44%, so the panel cannot answer an iPhone-only question.
Why do Reddit users say Safari ranks fourth on desktop?
Because it does. StatCounter recorded Safari at 5.66% of worldwide desktop page views in July 2026, behind Chrome at 70.58%, Edge at 11.15% and Firefox at 6.51%.
Which country has the highest Safari share?
Of the markets covered here, Canada recorded the highest at 32.52% of page views in July 2026. The United States followed at 29.74% and the United Kingdom at 29.04%. India recorded 3.12%.
How much revenue does Apple make from Safari?
Apple does not break this out. Google’s default search payments sit inside Services, which recorded $30,739 million in net sales for the quarter ended 27 June 2026, against $27,423 million a year earlier.
Sources
https://gs.statcounter.com/browser-market-share
https://developer.apple.com/support/app-store/
https://www.apple.com/newsroom/pdfs/fy2026q3/FY26_Q3_Consolidated_Financial_Statements.pdf
https://www.apple.com/newsroom/2026/07/apple-reports-third-quarter-results/